

Will Hedera avoid deeper losses amid weak momentum and ongoing sell pressure?

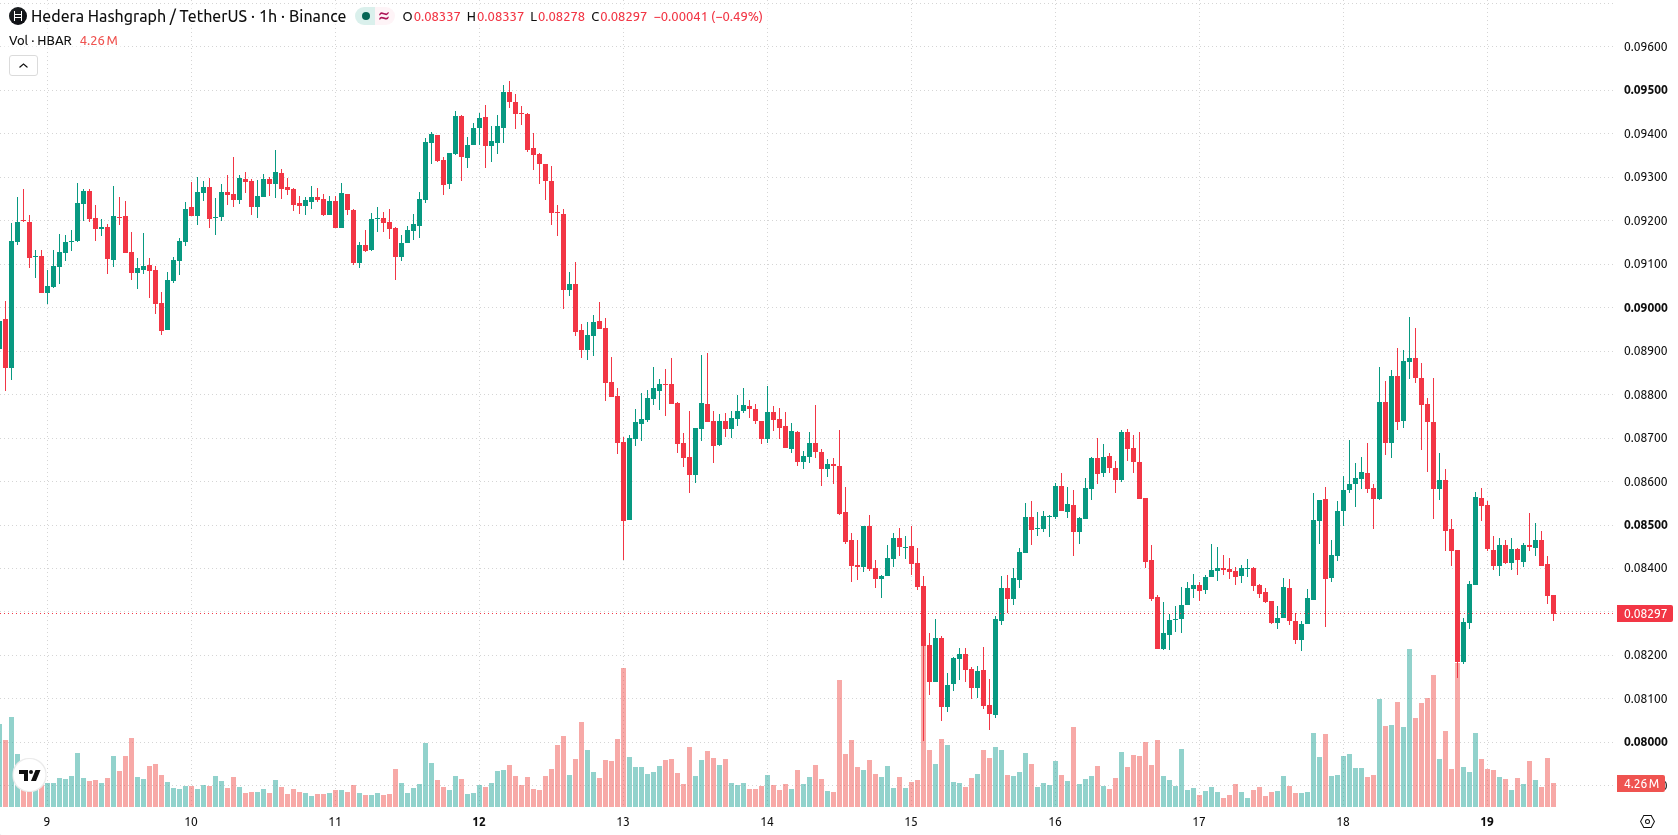
Hedera (HBAR) is trading at $0.083, marking a daily decline of 7.07%. The price sits below its main short- and medium-term moving averages, while maintaining its position above the longer-term trend level.
 0.0594
0.0676
Highlights
- Hedera has confirmed programmable Agent Accounts, allowing AI systems to transact with preset limits and no private keys.
- The new feature broadens Hedera's enterprise appeal for automated transactions but is limited to partner validation on testnet.
- HBAR trades in a bearish setup below short-term averages, with downside risk dominating the $0.078 to $0.0852 range.
Enterprise adoption potential rises as Agent Accounts debut
Hedera has introduced programmable Agent Accounts, which allow AI systems to transact within predefined spending limits and without requiring private keys, a development reported by Streetinsider. This confirmed product innovation broadens the network's flexibility and could enhance appeal to enterprises seeking automated transaction capabilities. While the testnet validation phase is only planned for partners at this stage, the announcement represents an expansion of Hedera's technical offering, though price action has remained under broader selling pressure.
Short-term resistance and bearish momentum curb recovery hopes
On the HBAR/USD hourly chart, price is currently below the MA-20 at $0.0844 and the MA-50 at $0.085, but remains above the MA-200 at $0.0818. The Ichimoku Kijun line stands at $0.0856, acting as immediate resistance. Momentum indicators are aligned negatively: MACD reflects a strong sell signal, RSI sits at 45.57 with a sell bias, and Bull/Bear Power underscores continued intraday seller control. ADX, Stochastic RSI, and CCI readings are neutral, indicating that while selling pressure dominates, there are no clear signals of an oversold reversal at present.
Downside risk increases as breakout odds remain limited
Over the next two to three trading days, HBAR/USD is expected to remain confined within a typical volatility band between $0.078 and $0.0852. The probability of an upward breakout is minimal, while the risk of a decisive move lower remains elevated. A bullish scenario would require a clear break above the $0.0856 Kijun level to trigger a potential short-term recovery, while any slide below $0.078 could accelerate downside momentum and open up further declines.
Earlier, analysts noted that Hedera was exhibiting strengthening technical support alongside rising institutional engagement, underpinned by recent network upgrades. The current analysis marks a shift toward increased downside risk as sustained selling pressure dominates, making a break below the $0.078 support level a critical factor for short-term market direction.














-
 Afghanistan
-
 Albania
-
 Algeria
-
 Angola
-
 Argentina
-
 Armenia
-
 Australia
-
 Austria
-
 Azerbaijan
-
 Bahamas
-
 Bahrain
-
 Bangladesh
-
 Belarus
-
 Belgium
-
 Bolivia
-
 Botswana
-
 Brazil
-
 Brunei
-
 Bulgaria
-
 Cambodia
-
 Cameroon
-
 Canada
-
 Chile
-
 China
-
 Colombia
-
 Congo
-
 Costa Rica
-
 Cote d'Ivoire
-
 Croatia
-
 Cuba
-
 Cyprus
-
 Czechia
-
 DR Congo
-
 Denmark
-
 Dominican Republic
-
 Ecuador
-
 Egypt
-
 El Salvador
-
 Estonia
-
 Eswatini
-
 Ethiopia
-
 Finland
-
 France
-
 Georgia
-
 Germany
-
 Ghana
-
 Greece
-
 Haiti
-
 Hong Kong
-
 Hungary
-
 India
-
 Indonesia
-
 Iran, Islamic republic
-
 Iraq
-
 Ireland
-
 Israel
-
 Italy
-
 Jamaica
-
 Japan
-
 Jordan
-
 Kazakhstan
-
 Kenya
-
 Korea
-
 Kuwait
-
 Kyrgyzstan
-
 Laos
-
 Latvia
-
 Lebanon
-
 Lesotho
-
 Libya
-
 Lithuania
-
 Luxembourg
-
 Madagascar
-
 Malaysia
-
 Malta
-
 Mauritius
-
 Mexico
-
 Moldova
-
 Mongolia
-
 Montenegro
-
 Morocco
-
 Mozambique
-
 Myanmar
-
 Namibia
-
 Nepal
-
 Netherlands
-
 New Zealand
-
 Nigeria
-
 North Macedonia
-
 Norway
-
 Oman
-
 Pakistan
-
 Palestine
-
 Panama
-
 Papua New Guinea
-
 Paraguay
-
 Peru
-
 Philippines
-
 Poland
-
 Portugal
-
 Puerto Rico
-
 Qatar
-
 Reunion
-
 Romania
-
 Rwanda
-
 Saudi Arabia
-
 Serbia
-
 Singapore
-
 Slovakia
-
 Slovenia
-
 Somalia
-
 South Africa
-
 Spain
-
 Sri Lanka
-
 Sweden
-
 Switzerland
-
 Syria
-
 Taiwan
-
 Tajikistan
-
 Tanzania
-
 Thailand
-
 Trinidad and Tobago
-
 Tunisia
-
 Turkey
-
 UAE
-
 Uganda
-
 Ukraine
-
 United Kingdom
-
United States
-
 Uruguay
-
 Uzbekistan
-
 Venezuela
-
 Vietnam
-
 Yemen
-
 Zambia
-
 Zimbabwe
- Forex
- Crypto












