

Hedera technical analysis: Upward price move meets resistance at $0.0927

Hedera (HBAR) is trading at $0.0893, rising 7.17% on the day and holding above its key moving averages.
 0.0724
0.0781
Highlights
- Hedera has introduced programmable Agent Accounts that allow AI-driven transactions without private key exposure for institutional and enterprise users.
- Network activity on Hedera has increased, with transactions per second up 168% and total value locked rising 12.3% to $33.2 million in 30 days.
- HBAR maintains a bullish technical structure with strong upward momentum and is expected to consolidate in the $0.0838 to $0.0927 range over the next 2 to 3 days.
Institutional participation rises as new agent feature boosts network activity
Hedera has introduced programmable Agent Accounts, enabling AI systems to conduct transactions within user-defined rules while eliminating exposure to private keys—a technological upgrade that expands the platform’s functional reach for institutions and enterprise participants. According to Streetinsider, network activity has surged, with transactions per second up 168% over the past 30 days and total value locked climbing 12.3% to $33.2 million, signals of heightened demand and deepening ecosystem engagement. The company’s involvement in the UK Wholesale Digital Markets Champion Industry Taskforce, alongside BlackRock and NatWest, further supports its credibility for regulated finance use cases. Together, these developments form a strong backdrop for increased institutional participation and market interest in the Hedera ecosystem.
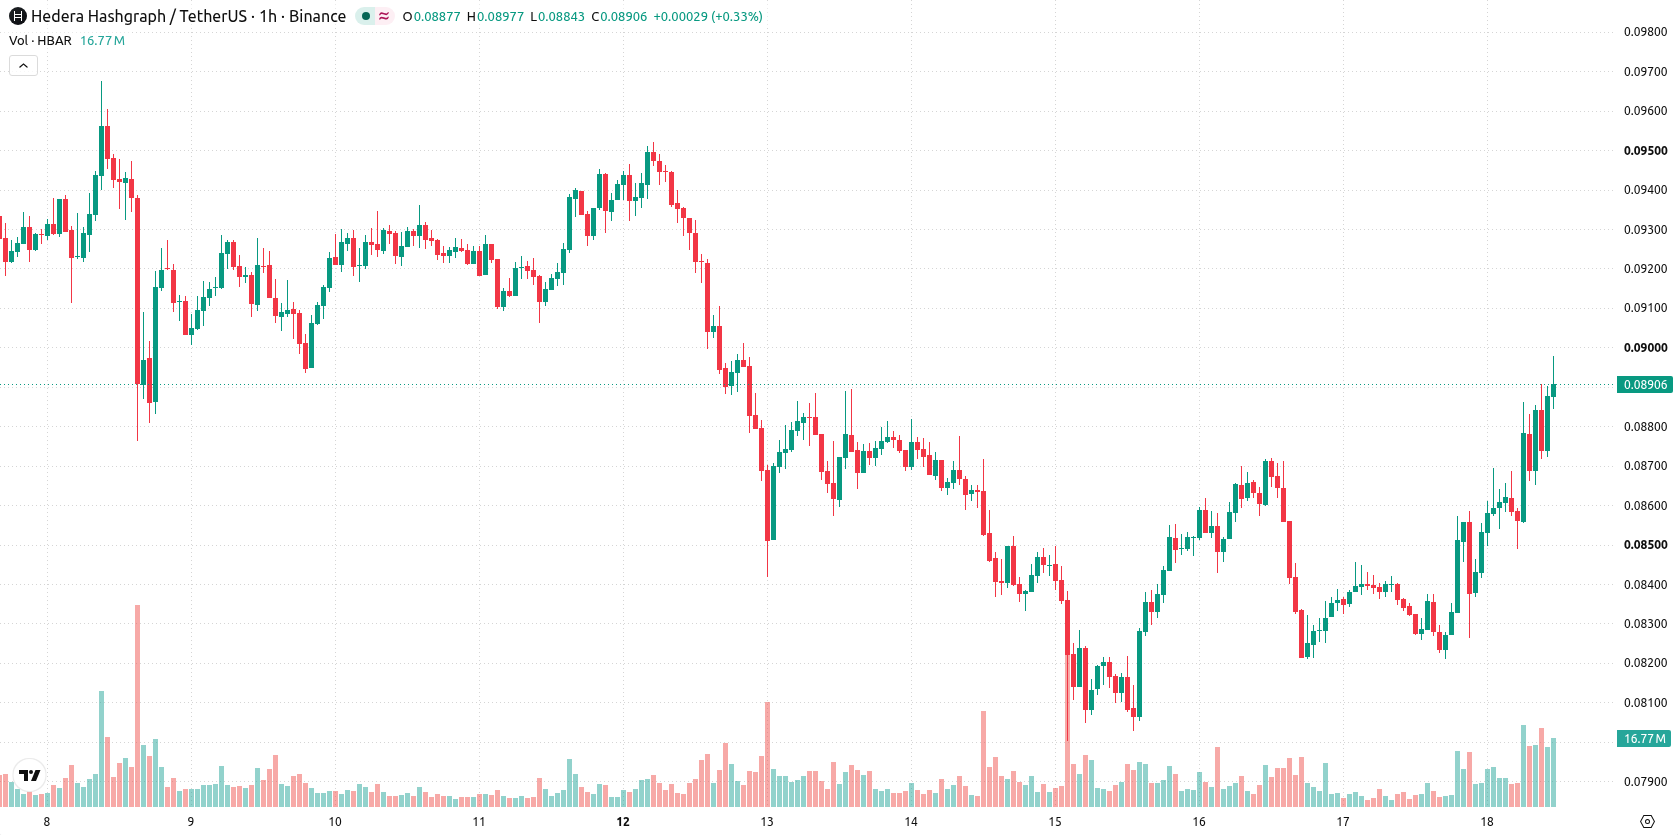
Mixed momentum signals as price nears upper range after support gains
On the technical front, HBAR/USD has surpassed the MA-20 at $0.0855 and MA-50 at $0.0846 on the hourly chart, while trading well above the MA-200 at $0.0818 on the daily timeframe. The Ichimoku Kijun level at $0.0856 is providing immediate support, and price is approaching the high end of the current daily range. Momentum indicators are mixed: MACD and ADX remain in Buy territory, confirming trend strength, while RSI reads 62.86 (Buy). However, CCI points to overbought conditions and Stoch RSI is neutral, highlighting the potential for short-term mean reversion despite positive underlying momentum. Bull/Bear Power still favors buyers and the Awesome Oscillator remains supportive of the uptrend.
Sideways outlook favored as strong support anchors short-term range
Over the next two to three sessions, HBAR/USD is expected to trade within a volatility band of $0.0838 to $0.0927. The most probable scenario is sideways consolidation inside this range, reflecting recent momentum and robust support levels. Should price break above resistance, the uptrend could accelerate, while a dip below support may prompt profit-taking and a deeper retracement.
Earlier, analysts noted that Hedera was experiencing sustained bearish momentum with technical signals pointing to a critical support area for short-term risk assessment. The current analysis reflects a shift, as price action now favors buyers with strong institutional engagement and technology upgrades, making the $0.0856 Ichimoku Kijun level a key support to monitor for potential breakout or retracement scenarios in the days ahead.






Latest HBAR News




-
 Afghanistan
-
 Albania
-
 Algeria
-
 Angola
-
 Argentina
-
 Armenia
-
 Australia
-
 Austria
-
 Azerbaijan
-
 Bahamas
-
 Bahrain
-
 Bangladesh
-
 Belarus
-
 Belgium
-
 Bolivia
-
 Botswana
-
 Brazil
-
 Brunei
-
 Bulgaria
-
 Cambodia
-
 Cameroon
-
 Canada
-
 Chile
-
 China
-
 Colombia
-
 Congo
-
 Costa Rica
-
 Cote d'Ivoire
-
 Croatia
-
 Cuba
-
 Cyprus
-
 Czechia
-
 DR Congo
-
 Denmark
-
 Dominican Republic
-
 Ecuador
-
 Egypt
-
 El Salvador
-
 Estonia
-
 Eswatini
-
 Ethiopia
-
 Finland
-
 France
-
 Georgia
-
 Germany
-
 Ghana
-
 Greece
-
 Haiti
-
 Hong Kong
-
 Hungary
-
 India
-
 Indonesia
-
 Iran, Islamic republic
-
 Iraq
-
 Ireland
-
 Israel
-
 Italy
-
 Jamaica
-
 Japan
-
 Jordan
-
 Kazakhstan
-
 Kenya
-
 Korea
-
 Kuwait
-
 Kyrgyzstan
-
 Laos
-
 Latvia
-
 Lebanon
-
 Lesotho
-
 Libya
-
 Lithuania
-
 Luxembourg
-
 Madagascar
-
 Malaysia
-
 Malta
-
 Mauritius
-
 Mexico
-
 Moldova
-
 Mongolia
-
 Montenegro
-
 Morocco
-
 Mozambique
-
 Myanmar
-
 Namibia
-
 Nepal
-
 Netherlands
-
 New Zealand
-
 Nigeria
-
 North Macedonia
-
 Norway
-
 Oman
-
 Pakistan
-
 Palestine
-
 Panama
-
 Papua New Guinea
-
 Paraguay
-
 Peru
-
 Philippines
-
 Poland
-
 Portugal
-
 Puerto Rico
-
 Qatar
-
 Reunion
-
 Romania
-
 Rwanda
-
 Saudi Arabia
-
 Serbia
-
 Singapore
-
 Slovakia
-
 Slovenia
-
 Somalia
-
 South Africa
-
 Spain
-
 Sri Lanka
-
 Sweden
-
 Switzerland
-
 Syria
-
 Taiwan
-
 Tajikistan
-
 Tanzania
-
 Thailand
-
 Trinidad and Tobago
-
 Tunisia
-
 Turkey
-
 UAE
-
 Uganda
-
 Ukraine
-
 United Kingdom
-
United States
-
 Uruguay
-
 Uzbekistan
-
 Venezuela
-
 Vietnam
-
 Yemen
-
 Zambia
-
 Zimbabwe
- Forex
- Crypto












