

Hedera weekly forecast: Support comes into focus after a stretched decline

Hedera (HBAR) is trading near $0.053 after a sharp drop of more than 15% over the past week, with support now coming into focus after this extended decline. Ongoing network upgrades and record development activity have yet to offset persistent selling pressure, setting the stage for continued caution as traders weigh corporate progress against lingering weakness.
 0.0545
0.0617
Highlights
- Hedera dropped 15.02% over the past 7 days to $0.0532, trading well below key moving averages.
- Indicators show a strong downward trend with oversold conditions, but potential for limited upside rebound exists.
- HBAR/USD is forecast to range between $0.0449 and $0.0576, with resistance at $0.0617 and elevated volatility expected.
Development records and mainnet upgrade highlight innovation amid service risks
Hedera is scheduled to upgrade its mainnet to software version v0.79 on November 18, 2026, with maintenance and possible temporary service disruptions expected, according to Cryptonews.net. This follows the completion of a testnet deployment earlier in the month and the project’s participation at the Singapore Fintech Festival where institutional blockchain solutions were showcased. Notably, data reported by CaptainAltcoin indicated that Hedera set a new record for development activity, averaging one GitHub commit every 39 seconds over a seven-day span.
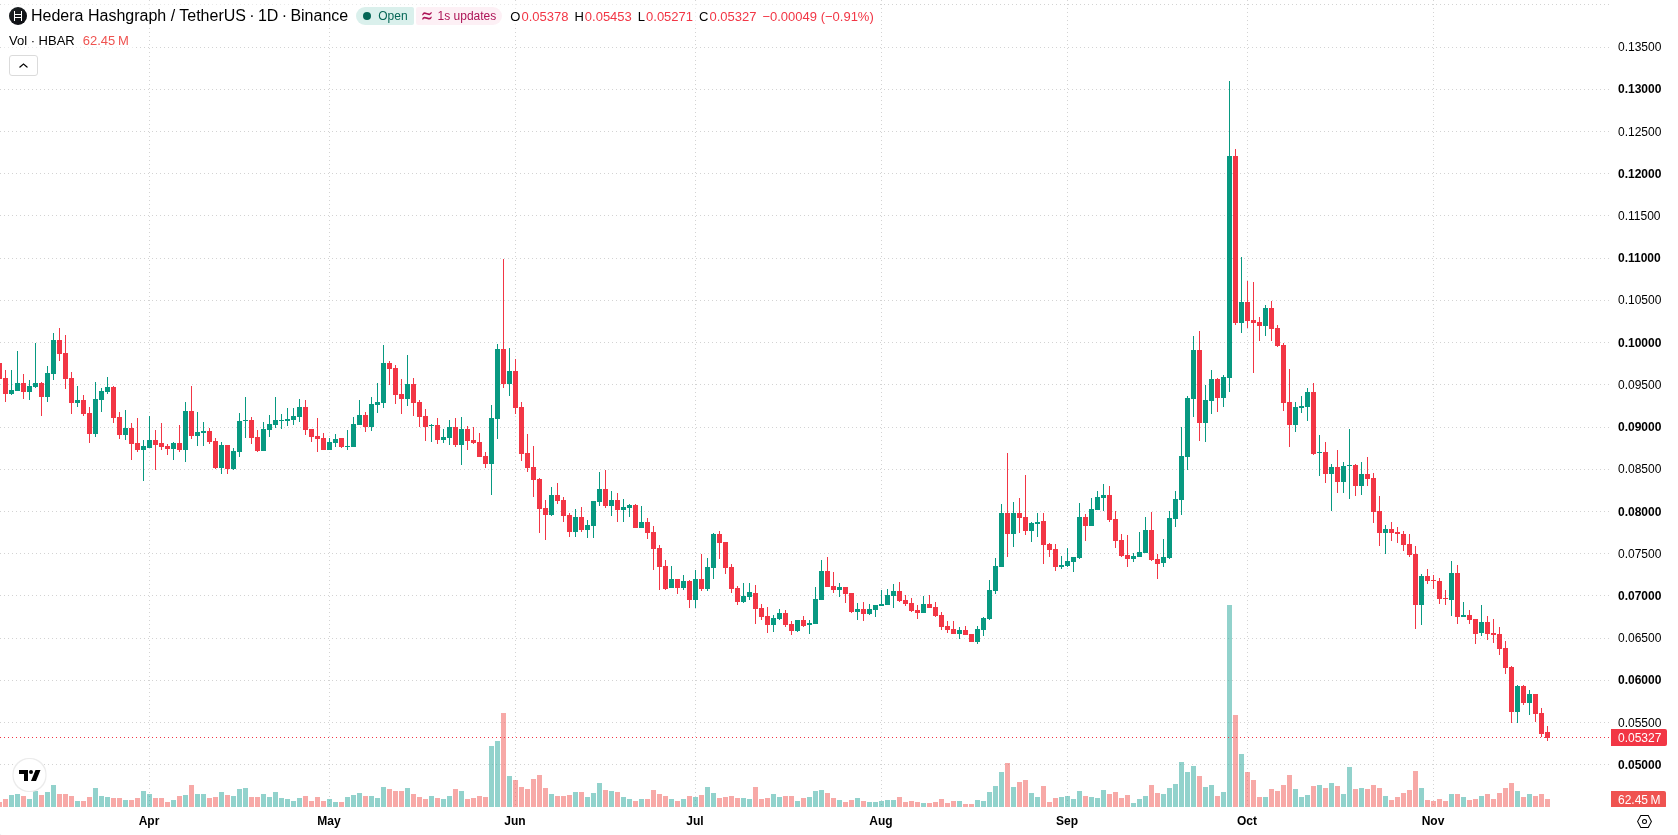
Oversold signals emerge as negative momentum and volatility persist this week
The daily chart reflects a sustained move lower with a firm trend, as confirmed by a high ADX reading and MACD signals pointing down. Both RSI (26.7432) and CCI (-129.4029) are oversold, suggesting possible selling exhaustion and some upside rebound potential, even as momentum remains negative. Nearest resistance stands at $0.0617, with the Ichimoku Kijun at $0.0666 acting as another resistance barrier. Volatility is elevated at 15.98%, increasing the likelihood of sharp price swings in the coming days.
Consolidation or further losses likely as resistance caps rebound attempts
In the week ahead, HBAR/USD is expected to trade between $0.0449 and $0.0576. There is a very high probability (more than 80%) of further declines and a very low probability (less than 20%) of a rebound. The base expectation is for consolidation or further weakness as long as price remains below $0.0617. A close above this resistance could trigger a short-term recovery attempt, while a move below $0.0449 would signal another leg lower.
Earlier, analysts noted that Hedera was likely to remain under short-term downside pressure despite ongoing institutional developments. The latest data reinforces this bearish outlook, with elevated volatility and oversold signals highlighting $0.0617 as the pivotal resistance level to watch for any potential reversal in the near term.











-
 Afghanistan
-
 Albania
-
 Algeria
-
 Angola
-
 Argentina
-
 Armenia
-
 Australia
-
 Austria
-
 Azerbaijan
-
 Bahamas
-
 Bahrain
-
 Bangladesh
-
 Belarus
-
 Belgium
-
 Bolivia
-
 Botswana
-
 Brazil
-
 Brunei
-
 Bulgaria
-
 Cambodia
-
 Cameroon
-
 Canada
-
 Chile
-
 China
-
 Colombia
-
 Congo
-
 Costa Rica
-
 Cote d'Ivoire
-
 Croatia
-
 Cuba
-
 Cyprus
-
 Czechia
-
 DR Congo
-
 Denmark
-
 Dominican Republic
-
 Ecuador
-
 Egypt
-
 El Salvador
-
 Estonia
-
 Eswatini
-
 Ethiopia
-
 Finland
-
 France
-
 Georgia
-
 Germany
-
 Ghana
-
 Greece
-
 Haiti
-
 Hong Kong
-
 Hungary
-
 India
-
 Indonesia
-
 Iran, Islamic republic
-
 Iraq
-
 Ireland
-
 Israel
-
 Italy
-
 Jamaica
-
 Japan
-
 Jordan
-
 Kazakhstan
-
 Kenya
-
 Korea
-
 Kuwait
-
 Kyrgyzstan
-
 Laos
-
 Latvia
-
 Lebanon
-
 Lesotho
-
 Libya
-
 Lithuania
-
 Luxembourg
-
 Madagascar
-
 Malaysia
-
 Malta
-
 Mauritius
-
 Mexico
-
 Moldova
-
 Mongolia
-
 Montenegro
-
 Morocco
-
 Mozambique
-
 Myanmar
-
 Namibia
-
 Nepal
-
 Netherlands
-
 New Zealand
-
 Nigeria
-
 North Macedonia
-
 Norway
-
 Oman
-
 Pakistan
-
 Palestine
-
 Panama
-
 Papua New Guinea
-
 Paraguay
-
 Peru
-
 Philippines
-
 Poland
-
 Portugal
-
 Puerto Rico
-
 Qatar
-
 Reunion
-
 Romania
-
 Rwanda
-
 Saudi Arabia
-
 Serbia
-
 Singapore
-
 Slovakia
-
 Slovenia
-
 Somalia
-
 South Africa
-
 Spain
-
 Sri Lanka
-
 Sweden
-
 Switzerland
-
 Syria
-
 Taiwan
-
 Tajikistan
-
 Tanzania
-
 Thailand
-
 Trinidad and Tobago
-
 Tunisia
-
 Turkey
-
 UAE
-
 Uganda
-
 Ukraine
-
 United Kingdom
-
United States
-
 Uruguay
-
 Uzbekistan
-
 Venezuela
-
 Vietnam
-
 Yemen
-
 Zambia
-
 Zimbabwe
- Forex
- Crypto












