

Can renewed ETF inflows support Bitcoin as risk-on sentiment builds?

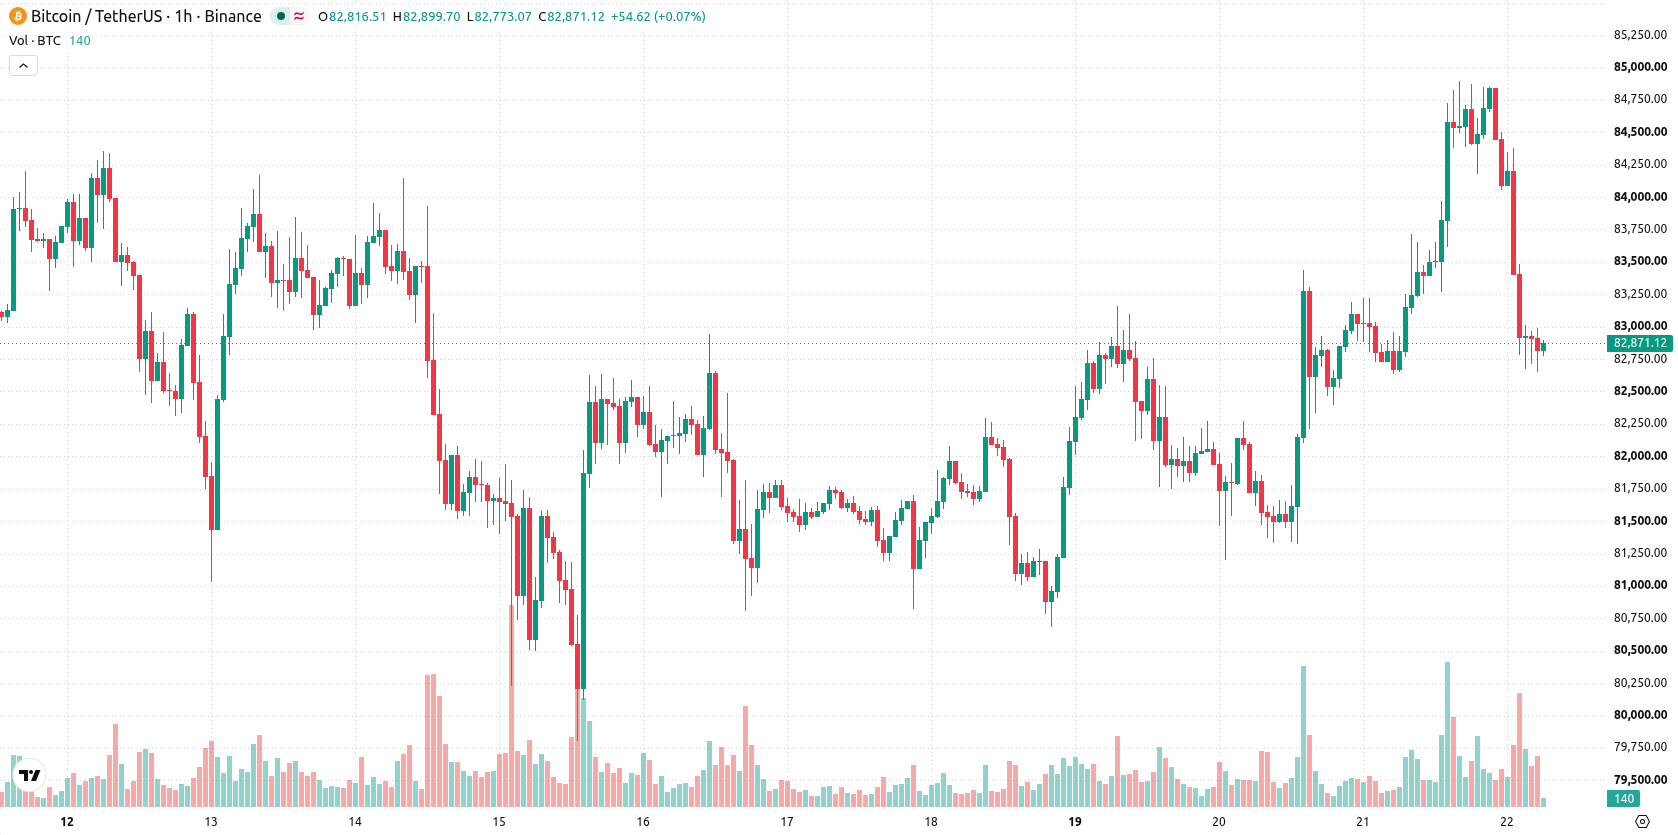
Bitcoin (BTC) is trading at $82,805, posting a modest gain on the day. The price remains positioned below short- and medium-term moving averages, while staying above longer-term support zones.
 66132.01
75599.22
Highlights
- Spot Bitcoin ETFs saw $2.3 billion in inflows over recent days, boosting institutional demand and market liquidity.
- A rebound in tech stocks is supporting broader risk-on flows into Bitcoin and increasing trading activity.
- BTC/USD trades below key short-term averages with momentum indicators indicating intraday weakness; expected range is $81,863 to $83,809 with a 52% probability of a downward move.
ETF inflows and tech rally drive renewed risk appetite for bitcoin
Renewed inflows into spot Bitcoin ETFs, totaling $2.3 billion in recent days, have provided a direct boost to institutional demand for Bitcoin, according to Benzinga and Briefs. This uptick in ETF activity increases overall market liquidity and encourages stronger buyer participation. Additionally, a simultaneous rebound in tech stocks has fostered a broader risk-on sentiment, supporting increased trading flows into Bitcoin and reinforcing the current market context.
Support holds as sell signals emerge amid oversold market
On the technical front, BTC trades below the MA-20 and MA-50 on the H1 chart, signaling short- and medium-term pressure, while the price holds above the long-term MA-200. The Ichimoku Kijun at $83,766 remains an important resistance level, with support nearby at $81,863. Among momentum indicators, MACD is neutral, while ADX signals a sell. RSI, CCI, Stochastic RSI, and Bull/Bear Power all indicate oversold conditions, pointing to dominant intraday selling. The Awesome Oscillator provides a strong sell signal, underscoring prevailing weakness alongside low intraday volatility. Notably, while most oscillators point to selling, their oversold readings diverge from the neutral MACD, requiring caution.
Consolidation likely as downside risk outweighs near-term upside
In the near term, BTC is expected to trade within the $81,863 to $83,809 volatility band relative to current levels. The probability of an upward move is assessed at 48%, while a downward scenario holds a slightly higher likelihood at 52%. Should price break above resistance at $83,766, further gains may be triggered; alternatively, a move below $81,863 support could confirm renewed downside risk. The baseline scenario sees BTC consolidating within this defined range over the next two to three trading days.
Earlier, analysts noted that JPMorgan had shifted its long-term stance on Bitcoin, emphasizing the cryptocurrency's potential for higher returns while maintaining caution due to its volatility. In the current environment—marked by rising institutional ETF inflows and strong technical boundaries—market participants should closely monitor the $83,766 resistance and $81,863 support levels for signs of an impending breakout or breakdown in the days ahead.










-
 Afghanistan
-
 Albania
-
 Algeria
-
 Angola
-
 Argentina
-
 Armenia
-
 Australia
-
 Austria
-
 Azerbaijan
-
 Bahamas
-
 Bahrain
-
 Bangladesh
-
 Belarus
-
 Belgium
-
 Bolivia
-
 Botswana
-
 Brazil
-
 Brunei
-
 Bulgaria
-
 Cambodia
-
 Cameroon
-
 Canada
-
 Chile
-
 China
-
 Colombia
-
 Congo
-
 Costa Rica
-
 Cote d'Ivoire
-
 Croatia
-
 Cuba
-
 Cyprus
-
 Czechia
-
 DR Congo
-
 Denmark
-
 Dominican Republic
-
 Ecuador
-
 Egypt
-
 El Salvador
-
 Estonia
-
 Eswatini
-
 Ethiopia
-
 Finland
-
 France
-
 Georgia
-
 Germany
-
 Ghana
-
 Greece
-
 Haiti
-
 Hong Kong
-
 Hungary
-
 India
-
 Indonesia
-
 Iran, Islamic republic
-
 Iraq
-
 Ireland
-
 Israel
-
 Italy
-
 Jamaica
-
 Japan
-
 Jordan
-
 Kazakhstan
-
 Kenya
-
 Korea
-
 Kuwait
-
 Kyrgyzstan
-
 Laos
-
 Latvia
-
 Lebanon
-
 Lesotho
-
 Libya
-
 Lithuania
-
 Luxembourg
-
 Madagascar
-
 Malaysia
-
 Malta
-
 Mauritius
-
 Mexico
-
 Moldova
-
 Mongolia
-
 Montenegro
-
 Morocco
-
 Mozambique
-
 Myanmar
-
 Namibia
-
 Nepal
-
 Netherlands
-
 New Zealand
-
 Nigeria
-
 North Macedonia
-
 Norway
-
 Oman
-
 Pakistan
-
 Palestine
-
 Panama
-
 Papua New Guinea
-
 Paraguay
-
 Peru
-
 Philippines
-
 Poland
-
 Portugal
-
 Puerto Rico
-
 Qatar
-
 Reunion
-
 Romania
-
 Rwanda
-
 Saudi Arabia
-
 Serbia
-
 Singapore
-
 Slovakia
-
 Slovenia
-
 Somalia
-
 South Africa
-
 Spain
-
 Sri Lanka
-
 Sweden
-
 Switzerland
-
 Syria
-
 Taiwan
-
 Tajikistan
-
 Tanzania
-
 Thailand
-
 Trinidad and Tobago
-
 Tunisia
-
 Turkey
-
 UAE
-
 Uganda
-
 Ukraine
-
 United Kingdom
-
United States
-
 Uruguay
-
 Uzbekistan
-
 Venezuela
-
 Vietnam
-
 Yemen
-
 Zambia
-
 Zimbabwe
- Forex
- Crypto












