

LTC slides over 5% as short- and medium-term technical pressure weigh on price

Litecoin (LTC) fell 5.3% after registering renewed outflows, as short- and medium-term selling pressure persisted. The move is supported by the token trading below both the 20-day and 50-day moving averages, with broad technical momentum remaining bearish.
 45.38
50.52
Highlights
- The Canary LTCC ETF, tied to Litecoin, saw $581,140 in net inflows, bringing total assets to about $14 million.
- Grayscale’s proposed conversion of its Litecoin Trust into an ETF for NYSE Arca listing is still pending.
- LTC/USD trades near $58.79 after a 5.3% drop, with persistent bearish momentum and a projected five-day range of $55.95 to $61.63.
ETF inflows and pending conversion offset by prolonged selling pressure
The Canary LTCC ETF, which is tied to Litecoin, registered a net inflow of $581,140, raising total assets to about $14 million after renewed inflows in September. Grayscale filed for conversion of its Litecoin Trust (LTCN) into an ETF to be listed on NYSE Arca, but this conversion remains pending. Litecoin also marked 15 years of uninterrupted blockchain operations, though price action has remained under broader selling pressure.
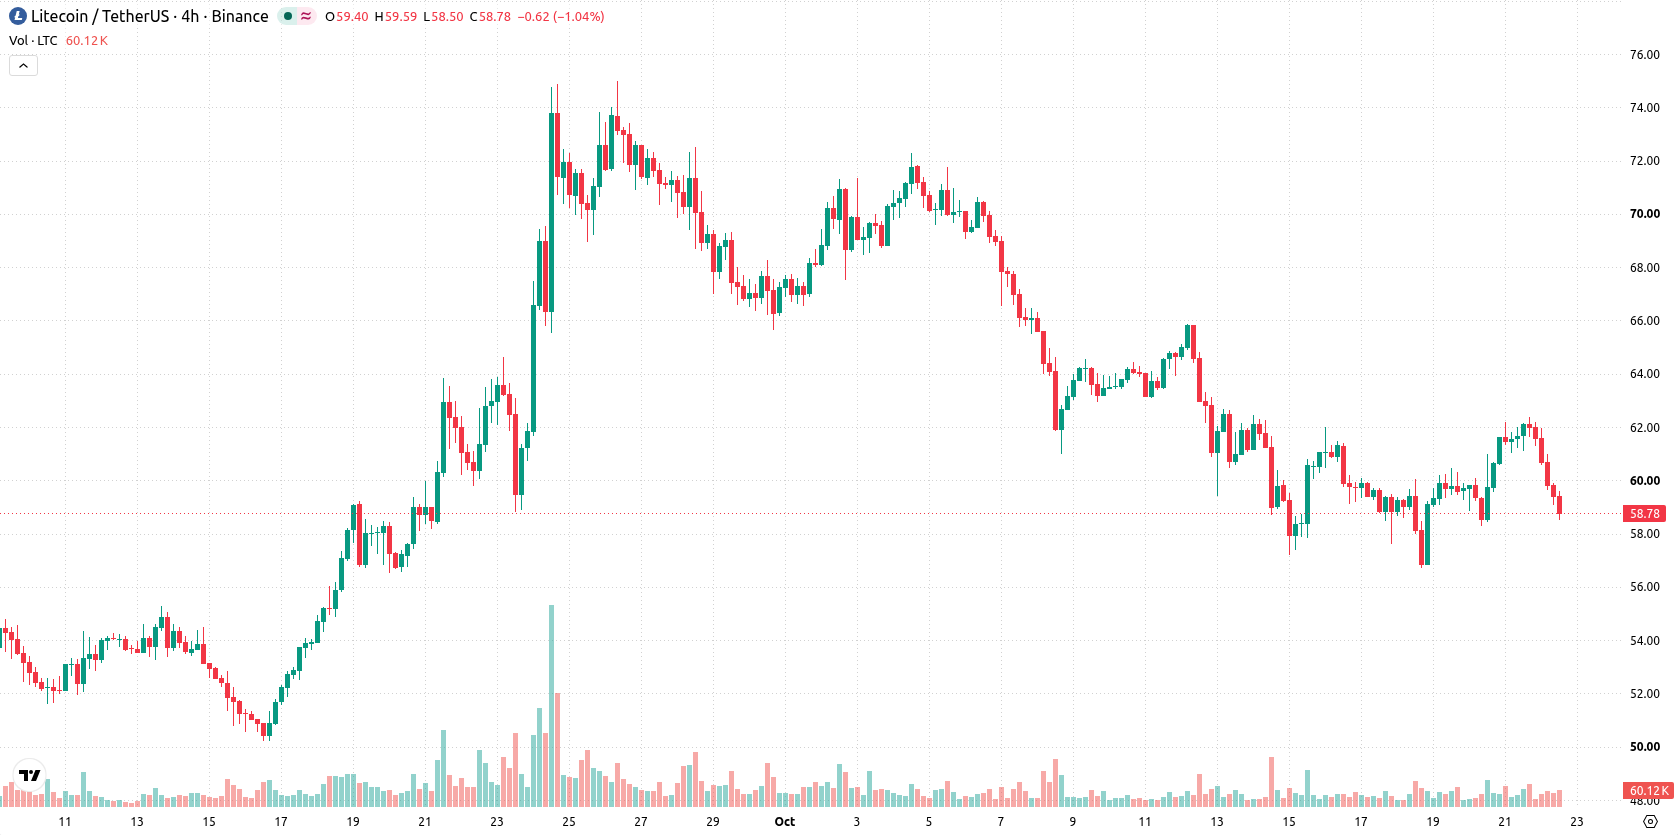
Short-term bearish signals intensify as intraday volatility increases
LTC/USD is currently trading below both the 20-day and 50-day moving averages at $63.74 and $60.88, but above the 200-day moving average at $52.07, signaling ongoing short- and medium-term pressure from sellers contrasted by a continued longer-term bullish bias. The near-term ceiling is established at $58.86, with support at the week low of $56.71, while the Ichimoku Kijun at $65.86 remains a distant resistance, reinforcing the bearish tilt in the shorter time frame. Momentum signals are clearly bearish, with the Moving Average Convergence Divergence (MACD) and Average Directional Index (ADX) both forecasting further downside. The Relative Strength Index (RSI) at 48.94 and Commodity Channel Index (CCI) at -39.15 show neither overt oversold nor overbought conditions, while the Stochastic RSI at 79.35 signals neutral momentum. Bull/Bear Power (BBP) is positive at 0.75, indicating buyers still dominate intraday, though the overbought forecast suggests the move may be stretched. The Awesome Oscillator confirms selling pressure, supporting the bearish momentum picture. The pair trades at $58.79, down $3.29 or 5.3% today, having opened with a downside gap of about 0.8%. Price is near the day’s low, with intraday volatility at 5.27%, reflecting persistent pressure since the open. This aligns the intraday tone with prevailing bearish momentum signals.
Earlier, analysts noted that Litecoin was experiencing persistent technical weakness despite indications of long-term stability and gradual institutional adoption. With the current market maintaining a dominant bearish tone under short- and medium-term selling pressure, traders should monitor the $61.63 resistance and $55.95 support as key inflection points that could define the next directional move.











-
 Afghanistan
-
 Albania
-
 Algeria
-
 Angola
-
 Argentina
-
 Armenia
-
 Australia
-
 Austria
-
 Azerbaijan
-
 Bahamas
-
 Bahrain
-
 Bangladesh
-
 Belarus
-
 Belgium
-
 Bolivia
-
 Botswana
-
 Brazil
-
 Brunei
-
 Bulgaria
-
 Cambodia
-
 Cameroon
-
 Canada
-
 Chile
-
 China
-
 Colombia
-
 Congo
-
 Costa Rica
-
 Cote d'Ivoire
-
 Croatia
-
 Cuba
-
 Cyprus
-
 Czechia
-
 DR Congo
-
 Denmark
-
 Dominican Republic
-
 Ecuador
-
 Egypt
-
 El Salvador
-
 Estonia
-
 Eswatini
-
 Ethiopia
-
 Finland
-
 France
-
 Georgia
-
 Germany
-
 Ghana
-
 Greece
-
 Haiti
-
 Hong Kong
-
 Hungary
-
 India
-
 Indonesia
-
 Iran, Islamic republic
-
 Iraq
-
 Ireland
-
 Israel
-
 Italy
-
 Jamaica
-
 Japan
-
 Jordan
-
 Kazakhstan
-
 Kenya
-
 Korea
-
 Kuwait
-
 Kyrgyzstan
-
 Laos
-
 Latvia
-
 Lebanon
-
 Lesotho
-
 Libya
-
 Lithuania
-
 Luxembourg
-
 Madagascar
-
 Malaysia
-
 Malta
-
 Mauritius
-
 Mexico
-
 Moldova
-
 Mongolia
-
 Montenegro
-
 Morocco
-
 Mozambique
-
 Myanmar
-
 Namibia
-
 Nepal
-
 Netherlands
-
 New Zealand
-
 Nigeria
-
 North Macedonia
-
 Norway
-
 Oman
-
 Pakistan
-
 Palestine
-
 Panama
-
 Papua New Guinea
-
 Paraguay
-
 Peru
-
 Philippines
-
 Poland
-
 Portugal
-
 Puerto Rico
-
 Qatar
-
 Reunion
-
 Romania
-
 Rwanda
-
 Saudi Arabia
-
 Serbia
-
 Singapore
-
 Slovakia
-
 Slovenia
-
 Somalia
-
 South Africa
-
 Spain
-
 Sri Lanka
-
 Sweden
-
 Switzerland
-
 Syria
-
 Taiwan
-
 Tajikistan
-
 Tanzania
-
 Thailand
-
 Trinidad and Tobago
-
 Tunisia
-
 Turkey
-
 UAE
-
 Uganda
-
 Ukraine
-
 United Kingdom
-
United States
-
 Uruguay
-
 Uzbekistan
-
 Venezuela
-
 Vietnam
-
 Yemen
-
 Zambia
-
 Zimbabwe
- Forex
- Crypto












