

What's behind Stacks's latest 10.4% price pullback?

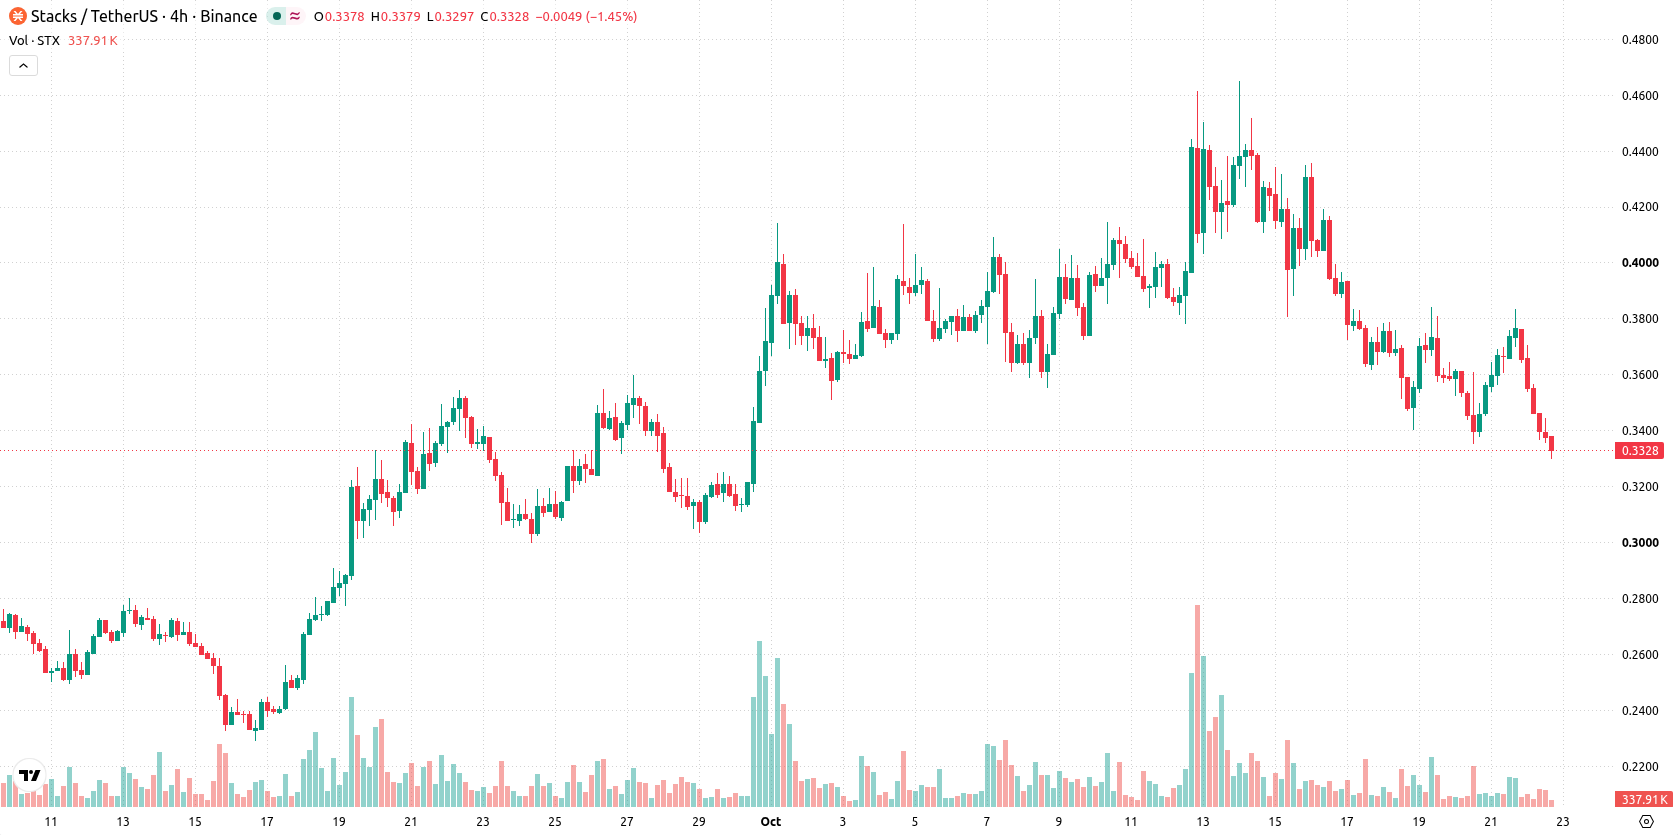
Stacks (STX) dropped 10.41% after recent sessions were marked by persistent market selling. The move is reinforced by the token’s position below the short-term moving average and immediate resistance at $0.3351, which signals that downside pressure currently outweighs medium- and long-term technical support.
 0.3483
0.3990
Highlights
- Stacks token faced sustained selling pressure with notable price declines in recent trading sessions.
- STX/USD has dropped 10.41% on the day and is trading near the session low amid heightened volatility of 10.07%.
- Technical indicators are mixed but lean bullish over the medium term, with an expected five-day trading range of $0.2751 to $0.3831 and a 74% probability of an upward move.
Sustained selling pressure as market sentiment shifts bearish
Stacks, the native token of the Stacks network that brings smart contracts to Bitcoin, experienced notable movements in recent sessions, with selling pressure prevailing in the market.
Mixed technical signals as short-term weakness contrasts long-term support
STX/USD is trading below the 20-day moving average at $0.3883 but slightly above the 50-day and 200-day moving averages at $0.3316 and $0.2302, respectively. This setup points to short-term pressure from sellers and medium- to long-term bullish trends, with near-term resistance seen at $0.3351 and support at $0.3316. Momentum indicators present a mixed yet slightly positive view: MACD and ADX indicate bullish momentum, the RSI is neutral but tilts toward a buy signal, and the Stochastic RSI forecasts a strong buy due to oversold conditions. By contrast, the CCI issues a sell, while Bull/Bear Power (BBP) is only modestly positive at 0.0036, suggesting buyers retain a narrow advantage during intraday action. The price is near session lows, volatility today is 10.07%, and the market tone reflects ongoing pressure after the opening gap down. Divergence among technical oscillators signals uncertainty, and the overall loss aligns with a weakened short-term momentum profile.
Earlier, analysts noted that Stacks maintained a structurally bullish outlook driven by institutional engagement and growing DeFi utility. The current retracement introduces a test of that thesis, with market participants now watching for a move above $0.3831 to signal renewed upside momentum or a drop below $0.2751 to confirm further downside risk.








-
 Afghanistan
-
 Albania
-
 Algeria
-
 Angola
-
 Argentina
-
 Armenia
-
 Australia
-
 Austria
-
 Azerbaijan
-
 Bahamas
-
 Bahrain
-
 Bangladesh
-
 Belarus
-
 Belgium
-
 Bolivia
-
 Botswana
-
 Brazil
-
 Brunei
-
 Bulgaria
-
 Cambodia
-
 Cameroon
-
 Canada
-
 Chile
-
 China
-
 Colombia
-
 Congo
-
 Costa Rica
-
 Cote d'Ivoire
-
 Croatia
-
 Cuba
-
 Cyprus
-
 Czechia
-
 DR Congo
-
 Denmark
-
 Dominican Republic
-
 Ecuador
-
 Egypt
-
 El Salvador
-
 Estonia
-
 Eswatini
-
 Ethiopia
-
 Finland
-
 France
-
 Georgia
-
 Germany
-
 Ghana
-
 Greece
-
 Haiti
-
 Hong Kong
-
 Hungary
-
 India
-
 Indonesia
-
 Iran, Islamic republic
-
 Iraq
-
 Ireland
-
 Israel
-
 Italy
-
 Jamaica
-
 Japan
-
 Jordan
-
 Kazakhstan
-
 Kenya
-
 Korea
-
 Kuwait
-
 Kyrgyzstan
-
 Laos
-
 Latvia
-
 Lebanon
-
 Lesotho
-
 Libya
-
 Lithuania
-
 Luxembourg
-
 Madagascar
-
 Malaysia
-
 Malta
-
 Mauritius
-
 Mexico
-
 Moldova
-
 Mongolia
-
 Montenegro
-
 Morocco
-
 Mozambique
-
 Myanmar
-
 Namibia
-
 Nepal
-
 Netherlands
-
 New Zealand
-
 Nigeria
-
 North Macedonia
-
 Norway
-
 Oman
-
 Pakistan
-
 Palestine
-
 Panama
-
 Papua New Guinea
-
 Paraguay
-
 Peru
-
 Philippines
-
 Poland
-
 Portugal
-
 Puerto Rico
-
 Qatar
-
 Reunion
-
 Romania
-
 Rwanda
-
 Saudi Arabia
-
 Serbia
-
 Singapore
-
 Slovakia
-
 Slovenia
-
 Somalia
-
 South Africa
-
 Spain
-
 Sri Lanka
-
 Sweden
-
 Switzerland
-
 Syria
-
 Taiwan
-
 Tajikistan
-
 Tanzania
-
 Thailand
-
 Trinidad and Tobago
-
 Tunisia
-
 Turkey
-
 UAE
-
 Uganda
-
 Ukraine
-
 United Kingdom
-
United States
-
 Uruguay
-
 Uzbekistan
-
 Venezuela
-
 Vietnam
-
 Yemen
-
 Zambia
-
 Zimbabwe
- Forex
- Crypto












