

Solana technical analysis: Range-bound trading with support pressure at $104.38

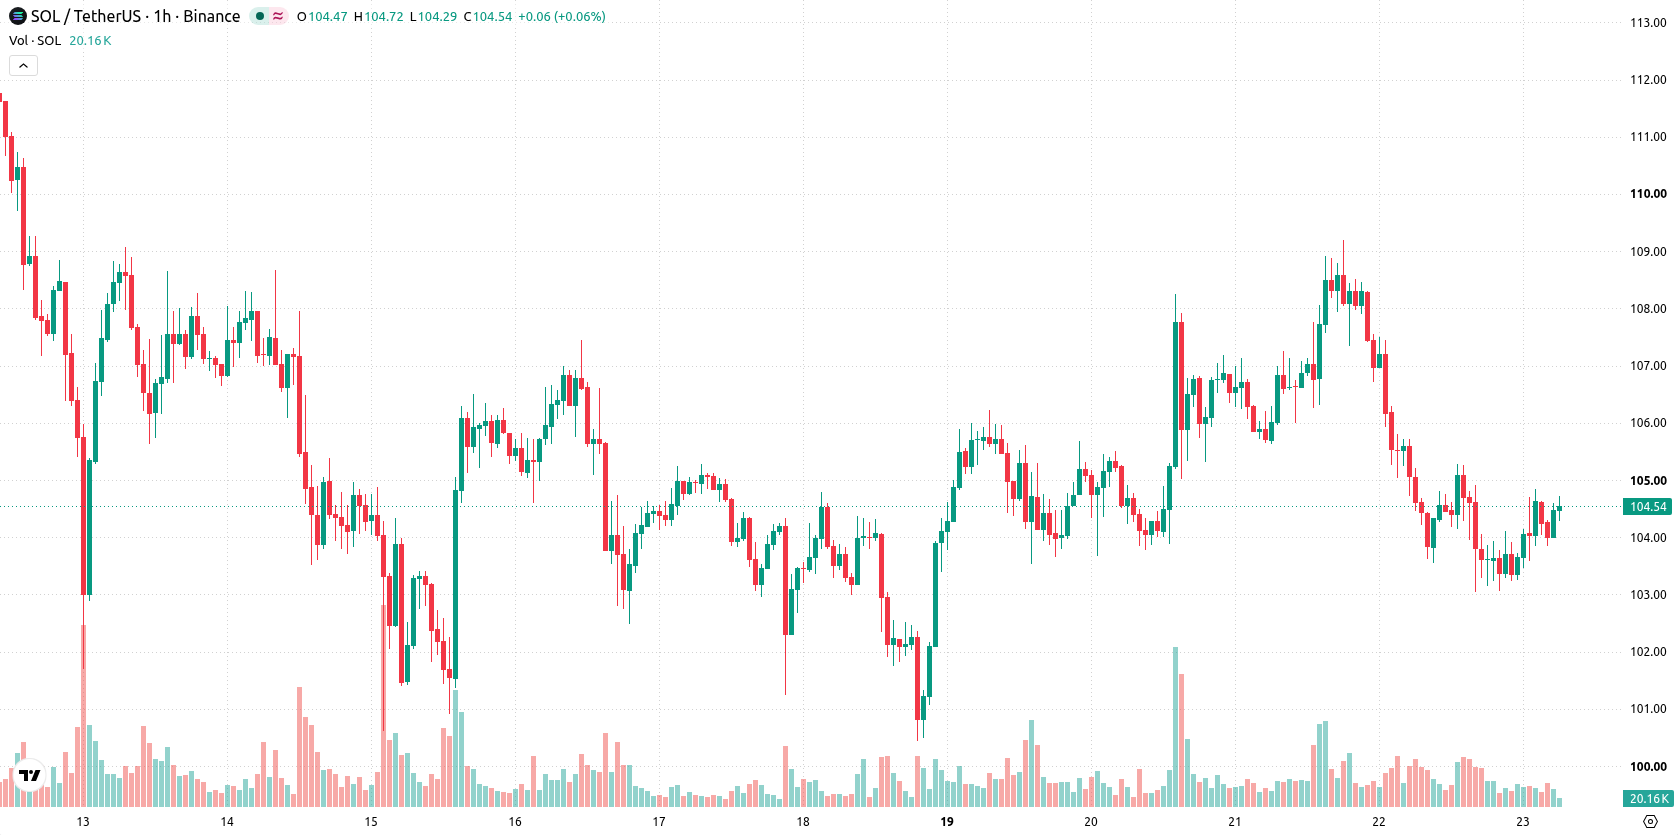
Solana (SOL) is trading at $104.56 after a slight pullback in the last session. The price sits above its key moving averages on a long-term basis but shows mixed positioning on shorter timeframes.
 93.41
103.85
Highlights
- Solana activated its Alpenglow consensus upgrade, reducing transaction finality from 12.8 seconds to 150 milliseconds and increasing network speed.
- JPMorgan introduced two tokenized money market funds on Solana, giving institutional investors blockchain access to traditional investment products via Morgan Money.
- SOL/USD trades near $104.56 with conflicted short- and medium-term signals, and is likely to consolidate between $102.26 and $106.52 over the next 2 to 3 days.
Transaction speed surge and fund launches drive institutional adoption
Solana activated its Alpenglow consensus upgrade on October 21, 2026, sharply reducing transaction finality from around 12.8 seconds to a target of 150 milliseconds. This protocol-level improvement has increased the speed and reliability of the network, further positioning Solana as a viable platform for fast, high-throughput applications by institutional users. The following day, JPMorgan launched two tokenized money market funds on the Solana blockchain, enabling institutional investors to access traditional investment products via Morgan Money, which adds to the asset’s on-chain utility and signals broader adoption among major financial players.
Mixed momentum signals as intraday strength clashes with selling pressure
On the hourly chart, SOL trades above the MA-20 and below the MA-50, while on the daily timeframe it remains well above the MA-200. Immediate technical support sits at the Ichimoku Kijun level of $104.38. Momentum indicators reflect mixed signals: MACD points toward strong selling pressure, confirmed by ADX, while RSI is at 47.99 (Sell) and Stochastic RSI reads Overbought, hinting at possible short-term exhaustion. CCI is neutral, and Bull/Bear Power shows strong buyer dominance intraday, highlighting a divergence between intraday and broader momentum.
Rangebound outlook as downside risk exceeds upside potential
Over the next two to three trading days, SOL is expected to fluctuate within a range of $102.26 to $106.52. The model assigns a 37% probability to an upward move and a 63% probability to further downside. The baseline scenario anticipates sideways consolidation within this volatility band, while a break above resistance may open the way for higher targets; conversely, a move below immediate support would likely trigger additional losses.
Earlier, analysts noted that Solana was under sustained selling pressure despite technical upgrades, with downside risks dominating the near-term outlook. New institutional adoption and shifts in short-term momentum now add complexity to the asset’s trading profile, making the $104.38 support level critical for assessing whether consolidation holds or further losses emerge.










-
 Afghanistan
-
 Albania
-
 Algeria
-
 Angola
-
 Argentina
-
 Armenia
-
 Australia
-
 Austria
-
 Azerbaijan
-
 Bahamas
-
 Bahrain
-
 Bangladesh
-
 Belarus
-
 Belgium
-
 Bolivia
-
 Botswana
-
 Brazil
-
 Brunei
-
 Bulgaria
-
 Cambodia
-
 Cameroon
-
 Canada
-
 Chile
-
 China
-
 Colombia
-
 Congo
-
 Costa Rica
-
 Cote d'Ivoire
-
 Croatia
-
 Cuba
-
 Cyprus
-
 Czechia
-
 DR Congo
-
 Denmark
-
 Dominican Republic
-
 Ecuador
-
 Egypt
-
 El Salvador
-
 Estonia
-
 Eswatini
-
 Ethiopia
-
 Finland
-
 France
-
 Georgia
-
 Germany
-
 Ghana
-
 Greece
-
 Haiti
-
 Hong Kong
-
 Hungary
-
 India
-
 Indonesia
-
 Iran, Islamic republic
-
 Iraq
-
 Ireland
-
 Israel
-
 Italy
-
 Jamaica
-
 Japan
-
 Jordan
-
 Kazakhstan
-
 Kenya
-
 Korea
-
 Kuwait
-
 Kyrgyzstan
-
 Laos
-
 Latvia
-
 Lebanon
-
 Lesotho
-
 Libya
-
 Lithuania
-
 Luxembourg
-
 Madagascar
-
 Malaysia
-
 Malta
-
 Mauritius
-
 Mexico
-
 Moldova
-
 Mongolia
-
 Montenegro
-
 Morocco
-
 Mozambique
-
 Myanmar
-
 Namibia
-
 Nepal
-
 Netherlands
-
 New Zealand
-
 Nigeria
-
 North Macedonia
-
 Norway
-
 Oman
-
 Pakistan
-
 Palestine
-
 Panama
-
 Papua New Guinea
-
 Paraguay
-
 Peru
-
 Philippines
-
 Poland
-
 Portugal
-
 Puerto Rico
-
 Qatar
-
 Reunion
-
 Romania
-
 Rwanda
-
 Saudi Arabia
-
 Serbia
-
 Singapore
-
 Slovakia
-
 Slovenia
-
 Somalia
-
 South Africa
-
 Spain
-
 Sri Lanka
-
 Sweden
-
 Switzerland
-
 Syria
-
 Taiwan
-
 Tajikistan
-
 Tanzania
-
 Thailand
-
 Trinidad and Tobago
-
 Tunisia
-
 Turkey
-
 UAE
-
 Uganda
-
 Ukraine
-
 United Kingdom
-
United States
-
 Uruguay
-
 Uzbekistan
-
 Venezuela
-
 Vietnam
-
 Yemen
-
 Zambia
-
 Zimbabwe
- Forex
- Crypto












