

Aptos rebound potential emerges as Stochastic RSI drops to oversold: weekly analysis

Aptos (APT) is trading near $0.77 after a sharp decline of more than 13% over the past week, with the chart now signaling deep oversold conditions and heightened volatility. Price action reflects ongoing indecision, as conflicting momentum signals complicate the outlook for a rebound or further weakness in the coming days.
 0.642
0.7300
Highlights
- Aptos fell 13.41% over the past 7 days to $0.7676, settling in the lower part of its weekly range.
- Price maintains a bullish long-term structure above key moving averages, but volatility is elevated and signals are mixed with oversold momentum indicators.
- The expected range for the coming week is $0.7016 to $0.8869, with 59% probability of a further decrease and $0.7448 as key support.
Tokenomics overhaul and governance actions reshape Aptos sentiment this week
Aptos implemented a sweeping overhaul of its tokenomics structure following four governance votes earlier in 2026, cutting its annual emission rate from 5% to 1.5%, reducing validator rewards, and imposing a cap of 2.1 billion tokens, a move Crypto Economy reports should contract issuance by about 70%. The network also rolled out an optional encrypted mempool on October 12, 2026, to enhance trading privacy, with the first use on Decibel’s derivatives platform, according to crypto.news. Meanwhile, Bitcoinist.com noted that despite burning about 174,000 APT through transaction fees over the last month, net supply continues to expand, and Yahoo Finance highlighted Aptos Labs' recent participation in a joint letter urging the SEC to establish clearer digital asset regulations.
Mixed momentum persists as daily chart reveals indecisive technical signals
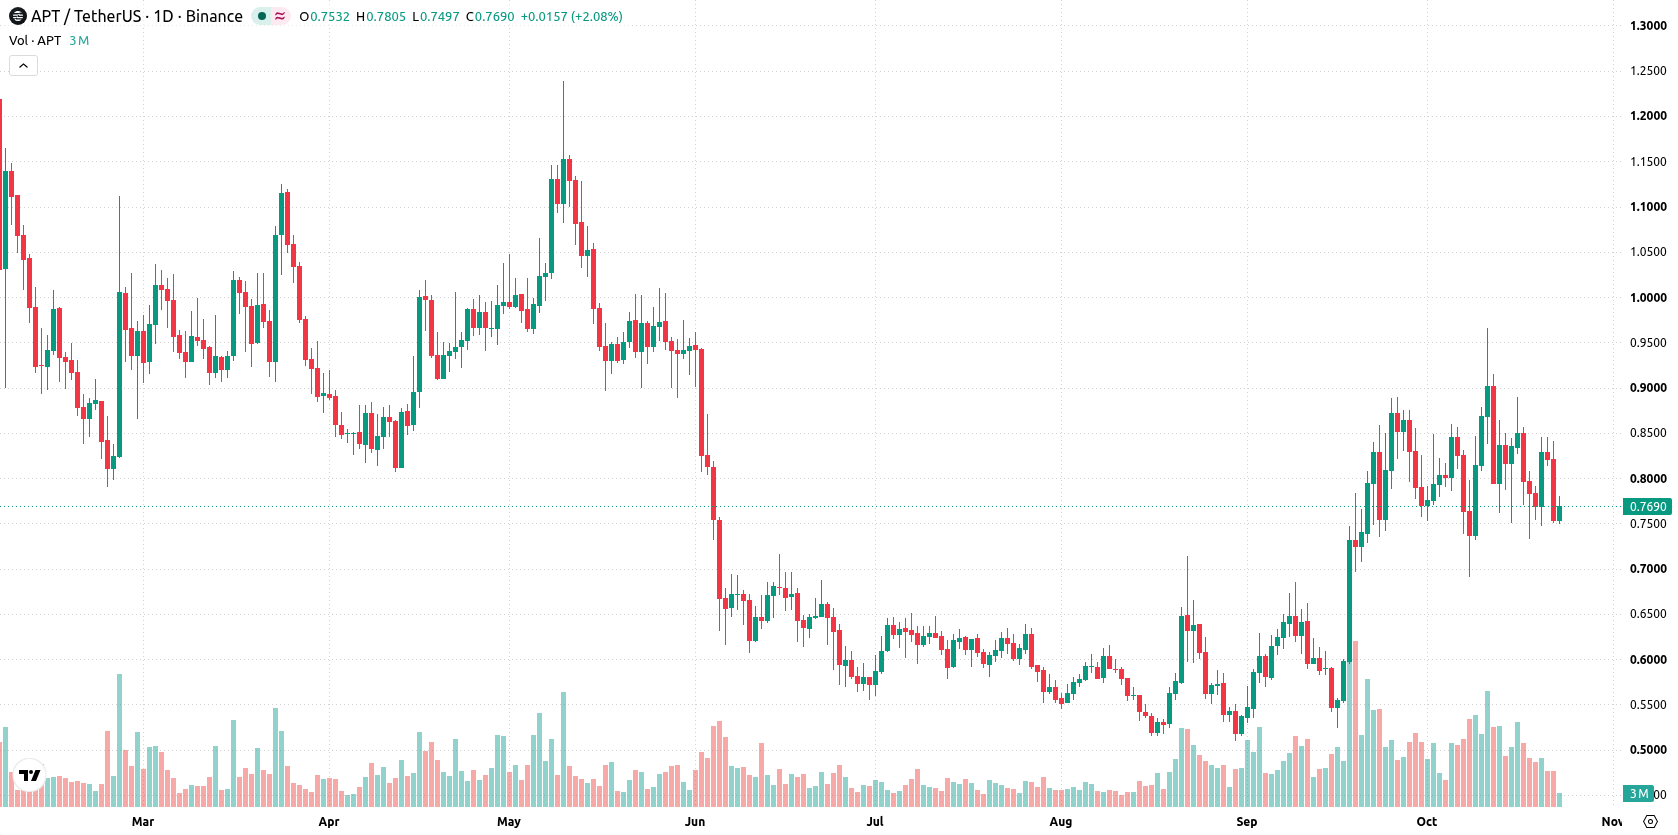
The daily chart structure shows a market experiencing a sharp move lower without a sustained trend, as volatility reached 17.03%. Momentum signals are mixed: Stochastic RSI is oversold at 0, suggesting potential for a rebound, while the MACD points to a strong buy even as the HMA issues a sell signal. Initial support sits at $0.7448, with resistance at the MA-20 of $0.8125 and secondary resistance at the Ichimoku Kijun around $0.8282. These technical cues highlight indecision, with signs of waning downside momentum but no confirmation of reversal yet.
Breakout risk rises next week as price stalls in broadening range
Over the coming week, the expected range is $0.7016 to $0.8869, with a 41% probability of an increase and a 59% probability of a decrease. The base case is further indecisive action between $0.7448 and $0.8125. A move above $0.8125 would open a test of $0.8282 and tilt momentum upward. Should Aptos break below the $0.7448 support, risk increases for a move toward the $0.7016 lower bound.
Earlier, analysts noted that Aptos was experiencing sustained bearish momentum with limited prospects for a near-term recovery. The current environment introduces heightened volatility and mixed momentum signals, making the $0.7448 level a critical line to monitor for breakdown risk and potential further downside.










-
 Afghanistan
-
 Albania
-
 Algeria
-
 Angola
-
 Argentina
-
 Armenia
-
 Australia
-
 Austria
-
 Azerbaijan
-
 Bahamas
-
 Bahrain
-
 Bangladesh
-
 Belarus
-
 Belgium
-
 Bolivia
-
 Botswana
-
 Brazil
-
 Brunei
-
 Bulgaria
-
 Cambodia
-
 Cameroon
-
 Canada
-
 Chile
-
 China
-
 Colombia
-
 Congo
-
 Costa Rica
-
 Cote d'Ivoire
-
 Croatia
-
 Cuba
-
 Cyprus
-
 Czechia
-
 DR Congo
-
 Denmark
-
 Dominican Republic
-
 Ecuador
-
 Egypt
-
 El Salvador
-
 Estonia
-
 Eswatini
-
 Ethiopia
-
 Finland
-
 France
-
 Georgia
-
 Germany
-
 Ghana
-
 Greece
-
 Haiti
-
 Hong Kong
-
 Hungary
-
 India
-
 Indonesia
-
 Iran, Islamic republic
-
 Iraq
-
 Ireland
-
 Israel
-
 Italy
-
 Jamaica
-
 Japan
-
 Jordan
-
 Kazakhstan
-
 Kenya
-
 Korea
-
 Kuwait
-
 Kyrgyzstan
-
 Laos
-
 Latvia
-
 Lebanon
-
 Lesotho
-
 Libya
-
 Lithuania
-
 Luxembourg
-
 Madagascar
-
 Malaysia
-
 Malta
-
 Mauritius
-
 Mexico
-
 Moldova
-
 Mongolia
-
 Montenegro
-
 Morocco
-
 Mozambique
-
 Myanmar
-
 Namibia
-
 Nepal
-
 Netherlands
-
 New Zealand
-
 Nigeria
-
 North Macedonia
-
 Norway
-
 Oman
-
 Pakistan
-
 Palestine
-
 Panama
-
 Papua New Guinea
-
 Paraguay
-
 Peru
-
 Philippines
-
 Poland
-
 Portugal
-
 Puerto Rico
-
 Qatar
-
 Reunion
-
 Romania
-
 Rwanda
-
 Saudi Arabia
-
 Serbia
-
 Singapore
-
 Slovakia
-
 Slovenia
-
 Somalia
-
 South Africa
-
 Spain
-
 Sri Lanka
-
 Sweden
-
 Switzerland
-
 Syria
-
 Taiwan
-
 Tajikistan
-
 Tanzania
-
 Thailand
-
 Trinidad and Tobago
-
 Tunisia
-
 Turkey
-
 UAE
-
 Uganda
-
 Ukraine
-
 United Kingdom
-
United States
-
 Uruguay
-
 Uzbekistan
-
 Venezuela
-
 Vietnam
-
 Yemen
-
 Zambia
-
 Zimbabwe
- Forex
- Crypto












