

VeChain stalls below resistance as buyers face headwinds at 20-day average: weekly analysis

VeChain (VET) is hovering around $0.0072 after gaining nearly 3% over the past week, as price momentum stalls just below key resistance. Mixed technical signals and institutional themes continue to shape the market, with buyers showing strength but headwinds still present. The coming days will test whether the breakout setup can build on this resilience or slips back toward support.
 0.004946
0.00534600
Highlights
- VeChain trades at $0.007156 after a 2.89% move up over the past week, showing a bullish long-term structure but short-term resistance.
- Technical indicators give mixed signals, with near-term momentum under pressure and an active long-term trend in place.
- Projected trading range for the week is $0.00647604 to $0.008116, with a 60% probability of a pullback and key support at $0.00641.
Enterprise adoption and AI integration drive institutional interest this week
VeChain continued its push into enterprise adoption this week, with Mediasnet.net reporting that its ecosystem is growing to support consumer applications, verified activity rewards, and AI integration. According to LiteFinance, long-term momentum is bolstered by ongoing expansion of the VeChainThor blockchain and infrastructure projects aimed at real-world use cases. Coinpedia noted additional positioning to serve as a trust layer for AI agents, reflecting increased institutional interest.
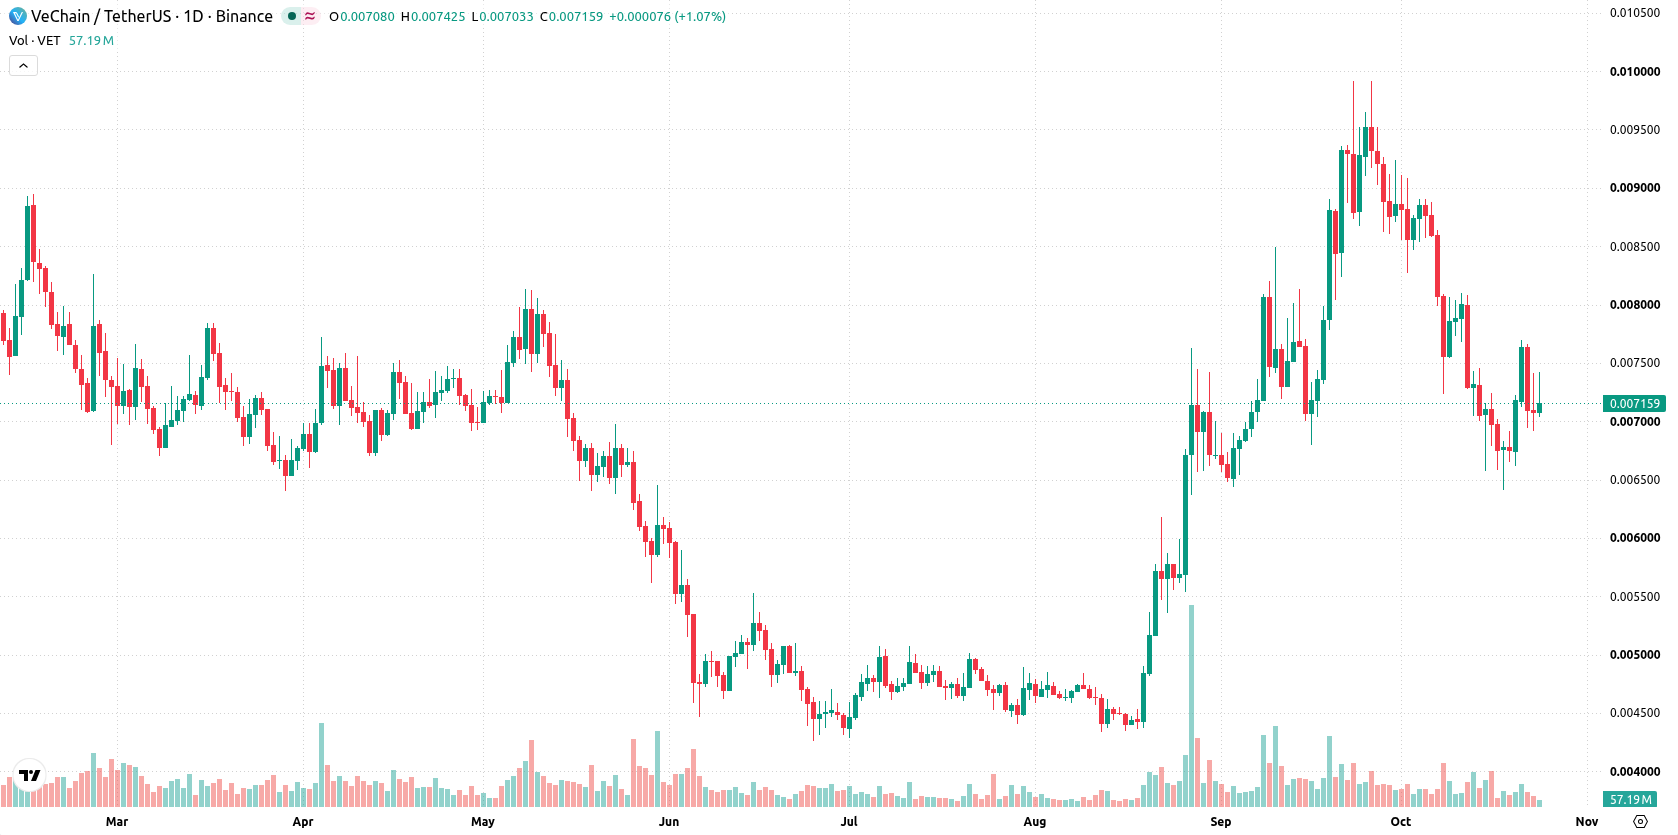
Mixed technical signals shape trend outlook as volatility tests support and resistance
The daily chart shows a trending setup, with a sustained move higher and a firm trend, though momentum signals are mixed. MACD signals a strong sell, but Bull/Bear Power shows buyer dominance, and the ADX at 32.13 underlines an active trend. The nearest support is at $0.00641, with resistance at the 20-day average of $0.00753665 and the Ichimoku Kijun at $0.007839. With volatility at 20.05%, the path forward hinges on whether price can reclaim resistance or slips back towards support.
Consolidation favored next week as breakout risks tilt toward downside
In the week ahead, VeChain is expected to trade between $0.00647604 and $0.008116, with a 40% probability of rising and a 60% probability of falling. The base case is continued consolidation between support at $0.00641 and resistance at $0.00753665. A break above $0.00753665 would target the upper end of the expected range, while a drop below $0.00641 would shift focus back to recent lows.
Earlier, analysts noted that VeChain was experiencing mixed technical signals and persistent downside momentum amid a balanced market structure. The current setup still reflects this indecision, with price action in a consolidation phase and traders advised to watch for a confirmed move above resistance as a signal of renewed directional strength.






Latest VeChain News






-
 Afghanistan
-
 Albania
-
 Algeria
-
 Angola
-
 Argentina
-
 Armenia
-
 Australia
-
 Austria
-
 Azerbaijan
-
 Bahamas
-
 Bahrain
-
 Bangladesh
-
 Belarus
-
 Belgium
-
 Bolivia
-
 Botswana
-
 Brazil
-
 Brunei
-
 Bulgaria
-
 Cambodia
-
 Cameroon
-
 Canada
-
 Chile
-
 China
-
 Colombia
-
 Congo
-
 Costa Rica
-
 Cote d'Ivoire
-
 Croatia
-
 Cuba
-
 Cyprus
-
 Czechia
-
 DR Congo
-
 Denmark
-
 Dominican Republic
-
 Ecuador
-
 Egypt
-
 El Salvador
-
 Estonia
-
 Eswatini
-
 Ethiopia
-
 Finland
-
 France
-
 Georgia
-
 Germany
-
 Ghana
-
 Greece
-
 Haiti
-
 Hong Kong
-
 Hungary
-
 India
-
 Indonesia
-
 Iran, Islamic republic
-
 Iraq
-
 Ireland
-
 Israel
-
 Italy
-
 Jamaica
-
 Japan
-
 Jordan
-
 Kazakhstan
-
 Kenya
-
 Korea
-
 Kuwait
-
 Kyrgyzstan
-
 Laos
-
 Latvia
-
 Lebanon
-
 Lesotho
-
 Libya
-
 Lithuania
-
 Luxembourg
-
 Madagascar
-
 Malaysia
-
 Malta
-
 Mauritius
-
 Mexico
-
 Moldova
-
 Mongolia
-
 Montenegro
-
 Morocco
-
 Mozambique
-
 Myanmar
-
 Namibia
-
 Nepal
-
 Netherlands
-
 New Zealand
-
 Nigeria
-
 North Macedonia
-
 Norway
-
 Oman
-
 Pakistan
-
 Palestine
-
 Panama
-
 Papua New Guinea
-
 Paraguay
-
 Peru
-
 Philippines
-
 Poland
-
 Portugal
-
 Puerto Rico
-
 Qatar
-
 Reunion
-
 Romania
-
 Rwanda
-
 Saudi Arabia
-
 Serbia
-
 Singapore
-
 Slovakia
-
 Slovenia
-
 Somalia
-
 South Africa
-
 Spain
-
 Sri Lanka
-
 Sweden
-
 Switzerland
-
 Syria
-
 Taiwan
-
 Tajikistan
-
 Tanzania
-
 Thailand
-
 Trinidad and Tobago
-
 Tunisia
-
 Turkey
-
 UAE
-
 Uganda
-
 Ukraine
-
 United Kingdom
-
United States
-
 Uruguay
-
 Uzbekistan
-
 Venezuela
-
 Vietnam
-
 Yemen
-
 Zambia
-
 Zimbabwe
- Forex
- Crypto












