

Arbitrum price prediction: Weak momentum and downside risk as sellers keep control

Arbitrum (ARB) is trading at $0.1694, down 6.92% on the day. The asset remains below its key short- and medium-term moving averages while staying above its long-term threshold.
 0.1652
0.1786
Highlights
- Arbitrum One daily active addresses rose fourfold in one week to a 90-day high of 572,000, with daily transactions up 25.7% to 1.7 million.
- Protocol revenue and stablecoin supply declined, with $300,000 in priority-fee revenue generated from 21 million advanced gas transactions in one month.
- ARB/USD trades below near-term moving averages with bearish momentum, projected to range from $0.1618 to $0.177 over the next sessions.
Surge in user activity contrasts with declines in revenue and liquidity
Arbitrum One's daily active address count surged to a 90-day high of 572,000 after a fourfold rise in one week, reflecting a rapid influx of new participants and heightened user engagement, according to Tokenpost. This expansion in network activity was accompanied by a 25.7% increase in daily transactions to 1.7 million, underscoring elevated on-chain interaction. Despite these positive operational milestones, overall revenue and stablecoin supply declined, which points to a contraction in protocol earnings and available liquidity. Additionally, $300,000 in priority-fee revenue was generated over one month from 21 million Priority Gas Auction transactions, signaling active use of premium services even as the broader environment remains challenging.
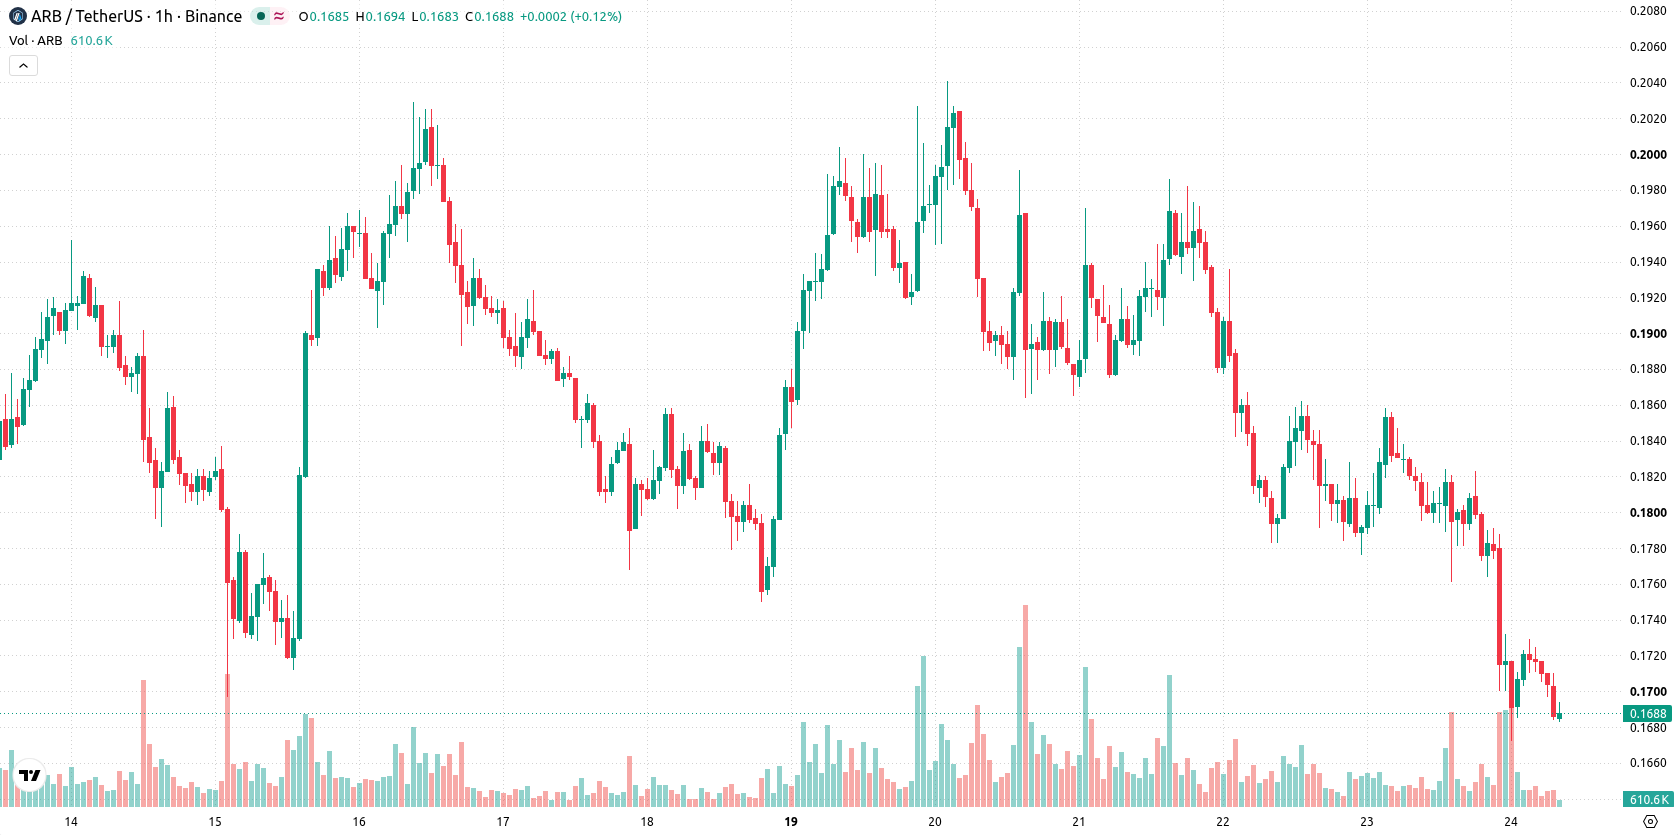
Bearish dominance confirmed as indicators align with resistance barriers
On the H1 timeframe, ARB/USD trades below the MA-20 at $0.1753 and MA-50 at $0.1792, with the long-term MA-200 sitting much lower at $0.1204. The Ichimoku Kijun serves as immediate resistance at $0.1755. On the indicator front, RSI reads 30.7, placing it in Sell territory; MACD and ADX both suggest continuing downside, while CCI also signals Sell. Stochastic RSI is neutral and Bull/Bear Power supports seller dominance on intraday momentum. Awesome Oscillator remains neutral, with all oscillator and momentum readings broadly confirming the prevailing bearish tone. No significant divergences between oscillators and price are observed.
Downside continuation likely as breakout catalysts remain absent
In the short term, ARB/USD is projected to range between $0.1618 and $0.177 over the next two to three sessions. The probability of an upward move appears very low, while continuation of the downside remains highly likely. The base scenario anticipates the price will hold in this sideways corridor, with potential bullish reversal signaled only by a sustained move above resistance at $0.1755. Continued selling and a breakdown below $0.1618 would reinforce momentum to the downside and open the path to further declines.
Earlier, analysts noted that Arbitrum was experiencing persistent bearish pressure despite ongoing ecosystem development and increased network activity. The latest data underscores and expands upon this outlook, with intensified on-chain participation yet declining revenue and liquidity reinforcing downside risks; traders should closely monitor the $0.1618 support level for signs of further weakness or potential stabilization.






Latest Arbitrum News





-
 Afghanistan
-
 Albania
-
 Algeria
-
 Angola
-
 Argentina
-
 Armenia
-
 Australia
-
 Austria
-
 Azerbaijan
-
 Bahamas
-
 Bahrain
-
 Bangladesh
-
 Belarus
-
 Belgium
-
 Bolivia
-
 Botswana
-
 Brazil
-
 Brunei
-
 Bulgaria
-
 Cambodia
-
 Cameroon
-
 Canada
-
 Chile
-
 China
-
 Colombia
-
 Congo
-
 Costa Rica
-
 Cote d'Ivoire
-
 Croatia
-
 Cuba
-
 Cyprus
-
 Czechia
-
 DR Congo
-
 Denmark
-
 Dominican Republic
-
 Ecuador
-
 Egypt
-
 El Salvador
-
 Estonia
-
 Eswatini
-
 Ethiopia
-
 Finland
-
 France
-
 Georgia
-
 Germany
-
 Ghana
-
 Greece
-
 Haiti
-
 Hong Kong
-
 Hungary
-
 India
-
 Indonesia
-
 Iran, Islamic republic
-
 Iraq
-
 Ireland
-
 Israel
-
 Italy
-
 Jamaica
-
 Japan
-
 Jordan
-
 Kazakhstan
-
 Kenya
-
 Korea
-
 Kuwait
-
 Kyrgyzstan
-
 Laos
-
 Latvia
-
 Lebanon
-
 Lesotho
-
 Libya
-
 Lithuania
-
 Luxembourg
-
 Madagascar
-
 Malaysia
-
 Malta
-
 Mauritius
-
 Mexico
-
 Moldova
-
 Mongolia
-
 Montenegro
-
 Morocco
-
 Mozambique
-
 Myanmar
-
 Namibia
-
 Nepal
-
 Netherlands
-
 New Zealand
-
 Nigeria
-
 North Macedonia
-
 Norway
-
 Oman
-
 Pakistan
-
 Palestine
-
 Panama
-
 Papua New Guinea
-
 Paraguay
-
 Peru
-
 Philippines
-
 Poland
-
 Portugal
-
 Puerto Rico
-
 Qatar
-
 Reunion
-
 Romania
-
 Rwanda
-
 Saudi Arabia
-
 Serbia
-
 Singapore
-
 Slovakia
-
 Slovenia
-
 Somalia
-
 South Africa
-
 Spain
-
 Sri Lanka
-
 Sweden
-
 Switzerland
-
 Syria
-
 Taiwan
-
 Tajikistan
-
 Tanzania
-
 Thailand
-
 Trinidad and Tobago
-
 Tunisia
-
 Turkey
-
 UAE
-
 Uganda
-
 Ukraine
-
 United Kingdom
-
United States
-
 Uruguay
-
 Uzbekistan
-
 Venezuela
-
 Vietnam
-
 Yemen
-
 Zambia
-
 Zimbabwe
- Forex
- Crypto












