

Arbitrum weekly forecast: Persistent downside momentum as MACD and ADX remain bearish

Arbitrum (ARB) is trading near $0.11 after falling more than 25% over the past week, with a stretched decline putting support levels in the spotlight. The focus now shifts to whether selling pressure will ease, potentially allowing for a technical rebound in the coming days.
 0.1143
0.1374
Highlights
- Arbitrum fell 25.25% over the past 7 days to $0.106, now trading below all major daily moving averages.
- All key momentum indicators remain deeply oversold, yet overall trend and structure are decisively bearish with persistent downside momentum.
- The expected 7-day range is $0.0917 to $0.1202, with immediate resistance at $0.1104 and no clear support nearby.
Ecosystem expansion and fresh partnerships drive weekly network activity
Arbitrum expanded its ecosystem by partnering with Cross River Bank and Harvest Finance, according to TokenPost and CryptoNews.net. The Arbitrum Foundation reported that network activity has resulted in $1.3 billion in total value locked and stablecoin balances near $4 billion, while 9.23 billion ARB tokens have been unlocked out of the 10 billion total supply, as outlined by Coin-Turk (source: Coin-Turk). In collaboration with Robinhood Chain, Arbitrum also launched the second cohort of its builder mentorship program featuring $100,000 in prizes, with builder applications shaping upcoming activity for both networks (source: Coin-Turk). Operations on the network saw Bitget News temporarily suspend and resume USDT withdrawals due to wallet maintenance, as confirmed through Bitget's official updates.
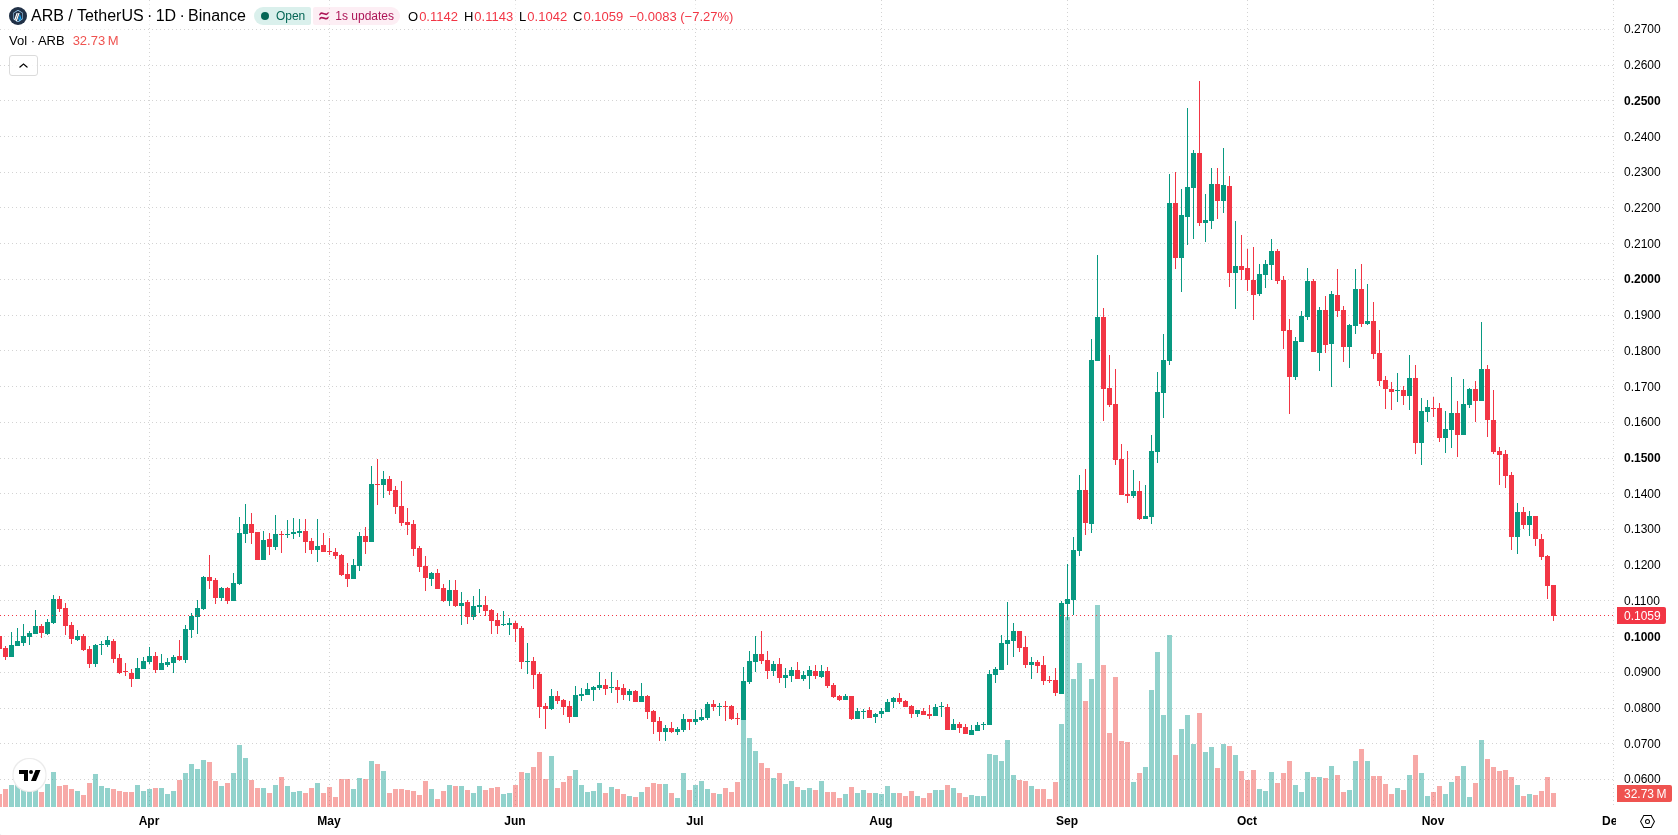
Oversold readings emerge as persistent downside momentum sets the tone
The daily chart points to a sustained move lower with a firm trend, driven by high 7-day volatility at 24.46%. All key momentum oscillators, including RSI at 28.4775, CCI at -147.5793, and Stochastic RSI at 0, are in oversold zones, suggesting the potential for an upside rebound even as the main trend remains decisively down. MACD, ADX, and HMA are all aligned with sell signals, highlighting persistent downside momentum. Immediate resistance is marked at $0.1104, with no nearby support level identified.
Further weakness likely barring a resistance breakout in the coming week
For the next 7 days, the expected range is $0.0917 to $0.1202. There is a very low probability (less than 20%) of a price increase and a very high probability (more than 80%) of a further decrease. The base case sees price holding below resistance at $0.1104 and remaining within this range. A break and close above $0.1104 could open the door to a minor short-term rebound, while a move below $0.0917 would signal renewed selling pressure and the potential for further declines.
Earlier, analysts noted that Arbitrum was experiencing persistent bearish momentum despite ongoing ecosystem developments and stablecoin growth. The present analysis strengthens this view with updated technical readings, highlighting elevated downside risk and making a potential break below $0.0917 a key level for traders to monitor in the days ahead.






Latest Arbitrum News




-
 Afghanistan
-
 Albania
-
 Algeria
-
 Angola
-
 Argentina
-
 Armenia
-
 Australia
-
 Austria
-
 Azerbaijan
-
 Bahamas
-
 Bahrain
-
 Bangladesh
-
 Belarus
-
 Belgium
-
 Bolivia
-
 Botswana
-
 Brazil
-
 Brunei
-
 Bulgaria
-
 Cambodia
-
 Cameroon
-
 Canada
-
 Chile
-
 China
-
 Colombia
-
 Congo
-
 Costa Rica
-
 Cote d'Ivoire
-
 Croatia
-
 Cuba
-
 Cyprus
-
 Czechia
-
 DR Congo
-
 Denmark
-
 Dominican Republic
-
 Ecuador
-
 Egypt
-
 El Salvador
-
 Estonia
-
 Eswatini
-
 Ethiopia
-
 Finland
-
 France
-
 Georgia
-
 Germany
-
 Ghana
-
 Greece
-
 Haiti
-
 Hong Kong
-
 Hungary
-
 India
-
 Indonesia
-
 Iran, Islamic republic
-
 Iraq
-
 Ireland
-
 Israel
-
 Italy
-
 Jamaica
-
 Japan
-
 Jordan
-
 Kazakhstan
-
 Kenya
-
 Korea
-
 Kuwait
-
 Kyrgyzstan
-
 Laos
-
 Latvia
-
 Lebanon
-
 Lesotho
-
 Libya
-
 Lithuania
-
 Luxembourg
-
 Madagascar
-
 Malaysia
-
 Malta
-
 Mauritius
-
 Mexico
-
 Moldova
-
 Mongolia
-
 Montenegro
-
 Morocco
-
 Mozambique
-
 Myanmar
-
 Namibia
-
 Nepal
-
 Netherlands
-
 New Zealand
-
 Nigeria
-
 North Macedonia
-
 Norway
-
 Oman
-
 Pakistan
-
 Palestine
-
 Panama
-
 Papua New Guinea
-
 Paraguay
-
 Peru
-
 Philippines
-
 Poland
-
 Portugal
-
 Puerto Rico
-
 Qatar
-
 Reunion
-
 Romania
-
 Rwanda
-
 Saudi Arabia
-
 Serbia
-
 Singapore
-
 Slovakia
-
 Slovenia
-
 Somalia
-
 South Africa
-
 Spain
-
 Sri Lanka
-
 Sweden
-
 Switzerland
-
 Syria
-
 Taiwan
-
 Tajikistan
-
 Tanzania
-
 Thailand
-
 Trinidad and Tobago
-
 Tunisia
-
 Turkey
-
 UAE
-
 Uganda
-
 Ukraine
-
 United Kingdom
-
United States
-
 Uruguay
-
 Uzbekistan
-
 Venezuela
-
 Vietnam
-
 Yemen
-
 Zambia
-
 Zimbabwe
- Forex
- Crypto












