

ARB moves higher as oversold Stoch RSI and neutral momentum shape trading

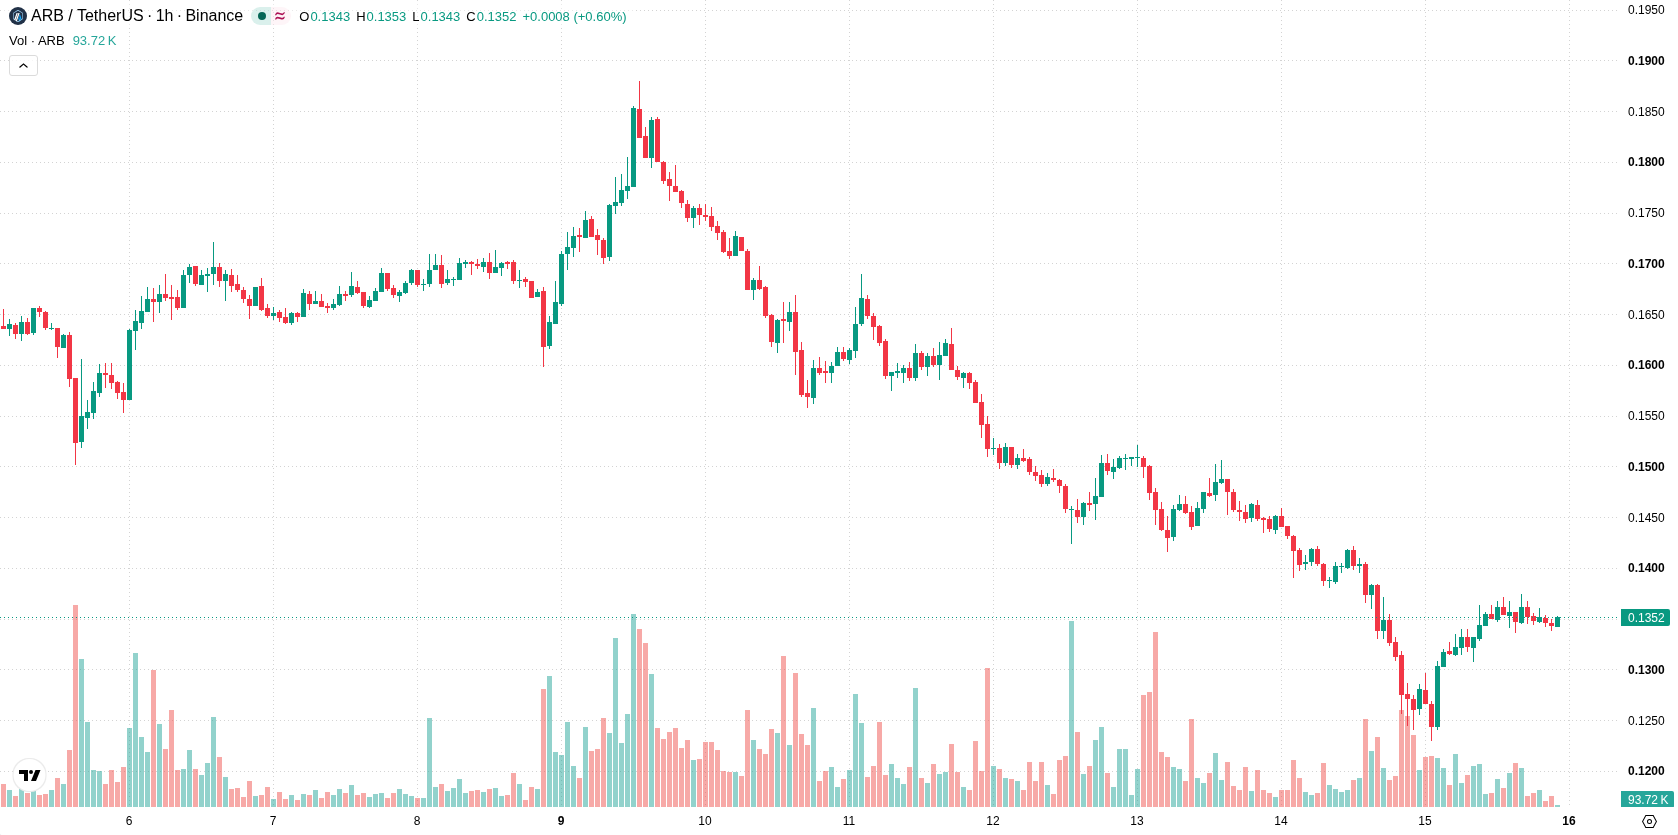
Arbitrum (ARB) is trading at $0.1348, posting a 6.56% gain for the day. The asset is currently positioned above its key short-term moving averages but faces intermediate resistance while holding above longer-term support levels.
 0.1374
0.1880
Highlights
- Arbitrum stablecoin market cap grew by $91.8 million in 24 hours, indicating increased on-chain liquidity and broader DeFi engagement.
- Arbitrum processed over 35 million transactions this week and earned $400,000 in priority fees, showing elevated network usage and protocol revenues.
- ARB/USD trades near intraday highs with short-term bullish momentum but is expected to remain range-bound from $0.1205 to $0.1512, with a high probability of a downward move.
Liquidity surge and network activity drive DeFi demand and revenue
Arbitrum has seen a notable $91.8 million rise in stablecoin market capitalization on its network over the past 24 hours, supporting a surge in on-chain liquidity and signaling heightened demand for decentralized finance applications, according to Tronweekly. Complementing this, the network processed more than 35 million transactions this week, while Arbitrum One chain generated over $400,000 in priority-fee revenue, both reported by Tokenpost, pointing to robust network activity and healthy protocol earnings. Additionally, the platform's recent launch of a Mentorship Program for early-stage DeFi projects reflects ongoing investment in ecosystem development and innovation.
Momentum neutral amid support at Ichimoku Kijun and oversold signals
On the technical front, ARB/USD is trading above the MA-20 but remains below the MA-50, with price also holding above the MA-200. The Ichimoku Kijun level at $0.1301 provides immediate support, while near-term resistance sits just below the $0.1512 mark. On the hourly chart, momentum indicators such as MACD and ADX show a neutral stance, with both RSI and CCI in their respective neutral zones. Notably, the Stochastic RSI is in the oversold territory, hinting at potential selling exhaustion, while Bull/Bear Power is marginally positive, indicating buyers are slightly dominant. An upward intraday gap of 0.0015 is present, and volatility remains high, producing mixed technical signals.
Downside risk increases if price breaks below volatility range
In the short term, ARB/USD is expected to trade within a range of $0.1205 to $0.1512, reflecting a typical volatility band relative to current levels. The likelihood of an upward move remains very low, with downside risk pronounced if the lower bound is breached. Barring a breakout above resistance or a significant move below support, the most probable scenario is a period of sideways price action within this corridor.
Earlier, analysts noted that Arbitrum was grappling with persistent downside pressure despite strong network growth indicators and increased stablecoin activity. Fresh evidence of robust transaction volume and protocol earnings now strengthens this outlook, making the $0.1205–$0.1512 trading range critical for traders monitoring imminent breakout or breakdown risks.










-
 Afghanistan
-
 Albania
-
 Algeria
-
 Angola
-
 Argentina
-
 Armenia
-
 Australia
-
 Austria
-
 Azerbaijan
-
 Bahamas
-
 Bahrain
-
 Bangladesh
-
 Belarus
-
 Belgium
-
 Bolivia
-
 Botswana
-
 Brazil
-
 Brunei
-
 Bulgaria
-
 Cambodia
-
 Cameroon
-
 Canada
-
 Chile
-
 China
-
 Colombia
-
 Congo
-
 Costa Rica
-
 Cote d'Ivoire
-
 Croatia
-
 Cuba
-
 Cyprus
-
 Czechia
-
 DR Congo
-
 Denmark
-
 Dominican Republic
-
 Ecuador
-
 Egypt
-
 El Salvador
-
 Estonia
-
 Eswatini
-
 Ethiopia
-
 Finland
-
 France
-
 Georgia
-
 Germany
-
 Ghana
-
 Greece
-
 Haiti
-
 Hong Kong
-
 Hungary
-
 India
-
 Indonesia
-
 Iran, Islamic republic
-
 Iraq
-
 Ireland
-
 Israel
-
 Italy
-
 Jamaica
-
 Japan
-
 Jordan
-
 Kazakhstan
-
 Kenya
-
 Korea
-
 Kuwait
-
 Kyrgyzstan
-
 Laos
-
 Latvia
-
 Lebanon
-
 Lesotho
-
 Libya
-
 Lithuania
-
 Luxembourg
-
 Madagascar
-
 Malaysia
-
 Malta
-
 Mauritius
-
 Mexico
-
 Moldova
-
 Mongolia
-
 Montenegro
-
 Morocco
-
 Mozambique
-
 Myanmar
-
 Namibia
-
 Nepal
-
 Netherlands
-
 New Zealand
-
 Nigeria
-
 North Macedonia
-
 Norway
-
 Oman
-
 Pakistan
-
 Palestine
-
 Panama
-
 Papua New Guinea
-
 Paraguay
-
 Peru
-
 Philippines
-
 Poland
-
 Portugal
-
 Puerto Rico
-
 Qatar
-
 Reunion
-
 Romania
-
 Rwanda
-
 Saudi Arabia
-
 Serbia
-
 Singapore
-
 Slovakia
-
 Slovenia
-
 Somalia
-
 South Africa
-
 Spain
-
 Sri Lanka
-
 Sweden
-
 Switzerland
-
 Syria
-
 Taiwan
-
 Tajikistan
-
 Tanzania
-
 Thailand
-
 Trinidad and Tobago
-
 Tunisia
-
 Turkey
-
 UAE
-
 Uganda
-
 Ukraine
-
 United Kingdom
-
United States
-
 Uruguay
-
 Uzbekistan
-
 Venezuela
-
 Vietnam
-
 Yemen
-
 Zambia
-
 Zimbabwe
- Forex
- Crypto












