

ARB drops as seller pressure dominates intraday trading

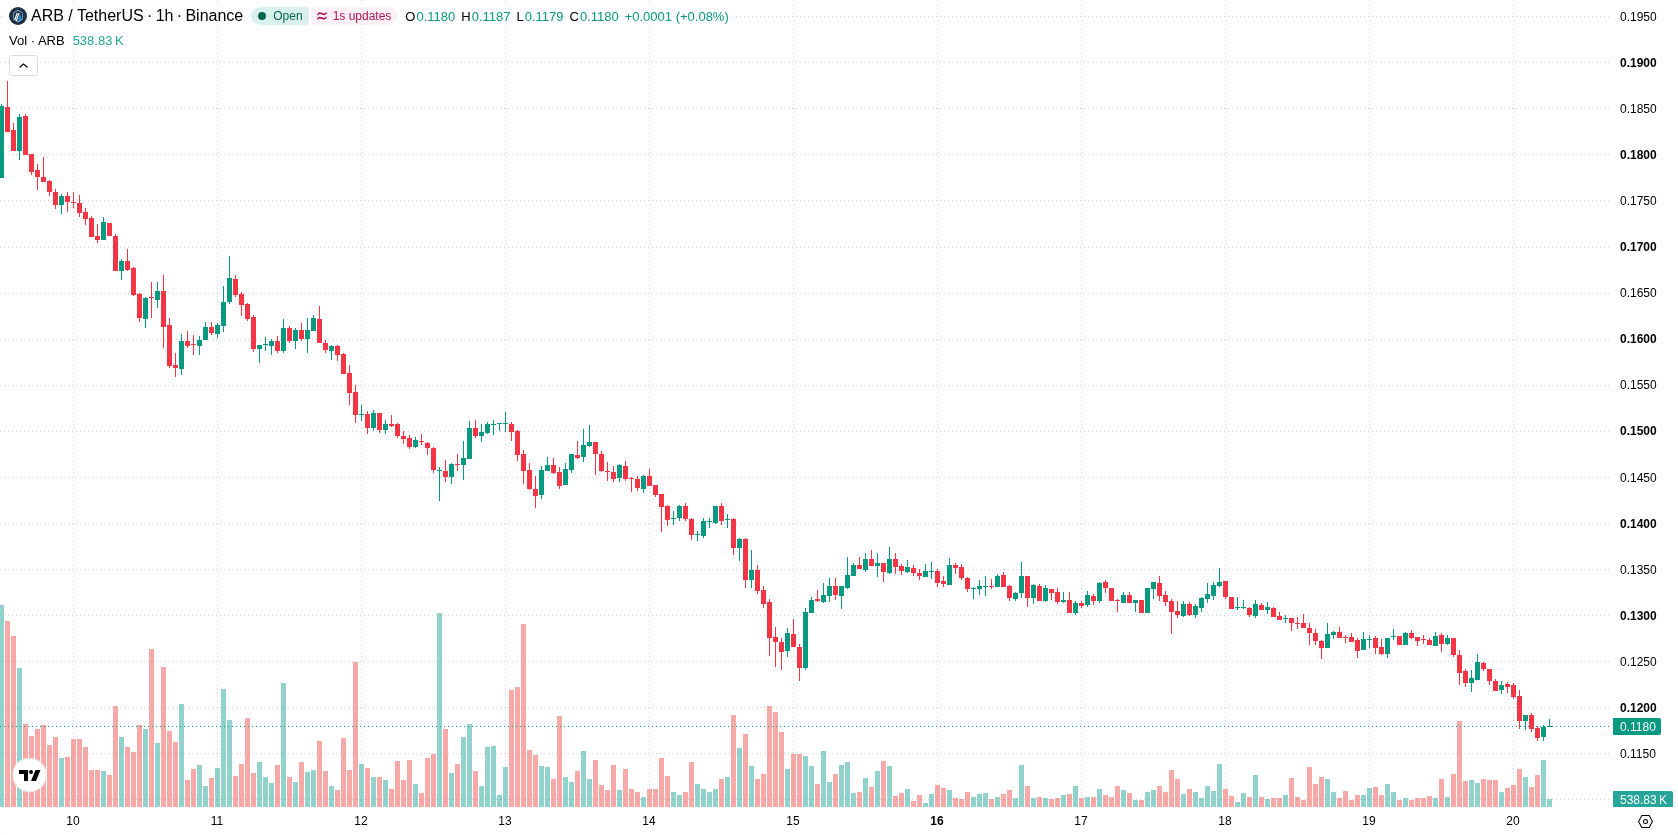
Arbitrum (ARB) is trading at $0.1186 after falling 6.54% today. The asset remains positioned below its key moving averages, highlighting ongoing selling momentum throughout the session.
 0.1226
0.1459
Highlights
- Arbitrum has launched a new builder mentorship program in partnership with Robinhood Chain with a $100,000 prize pool to attract developers.
- The platform saw a $352.6 million increase in stablecoin market cap in the past week, indicating rising liquidity and user activity.
- ARB/USD trades below key technical averages with momentum indicators showing strong selling pressure, projecting a likely range of $0.0998 to $0.1241 in the next trading day.
Builder incentives and fresh capital flows amid broad market pressure
Arbitrum has opened applications for a second builder mentorship cohort in partnership with Robinhood Chain, offering a $100,000 prize pool and aiming to spur new developer participation, according to Tokenpost. The platform also recorded an increase of $352.6 million in stablecoin market cap over the past week, reflecting a notable influx of liquidity and ongoing network activity, as reported by Cryptobriefing. Additionally, the launch of Fluton's mainnet on Arbitrum has introduced privacy transfers and encrypted balance capabilities for users. These positive developments were accompanied by broader market selling pressure.
Multiple downside signals as price holds below key resistance
ARB/USD is trading below three key reference points: the H1 SMA-20 at $0.1227, the H1 SMA-50 at $0.126, and the D1 SMA-200 at $0.1249, with the Ichimoku Kijun at $0.1224 acting as immediate resistance on the chart. Momentum remains negative: both MACD and ADX indicate ongoing selling pressure, with the Awesome Oscillator also confirming the bearish intraday bias. RSI, Stoch RSI, and CCI are all in their oversold territories, suggesting that recent downside has pushed momentum indicators into exhaustion. Bull/Bear Power holds a negative value, highlighting intraday dominance by sellers.
Downside risk persists as lows test support with weak momentum
In the short term, the projected trading range for ARB/USD is between support at $0.0998 and resistance at $0.1241. With negative momentum readings and price action near the daily low, the probability of further downside is high while an immediate rebound remains less likely. If ARB/USD consolidates above current support, a baseline scenario would see sideways movement between these levels. A decisive break below $0.0998 would open the door to additional losses, while a move above the $0.1224 Kijun could trigger short covering given the oversold backdrop.
Earlier, analysts noted that Arbitrum was grappling with sustained downside pressure despite robust network activity and ecosystem development efforts. The latest price action and oversold technical readings reinforce this bearish scenario, making the $0.0998 support level a critical threshold for traders monitoring the risk of further declines.










-
 Afghanistan
-
 Albania
-
 Algeria
-
 Angola
-
 Argentina
-
 Armenia
-
 Australia
-
 Austria
-
 Azerbaijan
-
 Bahamas
-
 Bahrain
-
 Bangladesh
-
 Belarus
-
 Belgium
-
 Bolivia
-
 Botswana
-
 Brazil
-
 Brunei
-
 Bulgaria
-
 Cambodia
-
 Cameroon
-
 Canada
-
 Chile
-
 China
-
 Colombia
-
 Congo
-
 Costa Rica
-
 Cote d'Ivoire
-
 Croatia
-
 Cuba
-
 Cyprus
-
 Czechia
-
 DR Congo
-
 Denmark
-
 Dominican Republic
-
 Ecuador
-
 Egypt
-
 El Salvador
-
 Estonia
-
 Eswatini
-
 Ethiopia
-
 Finland
-
 France
-
 Georgia
-
 Germany
-
 Ghana
-
 Greece
-
 Haiti
-
 Hong Kong
-
 Hungary
-
 India
-
 Indonesia
-
 Iran, Islamic republic
-
 Iraq
-
 Ireland
-
 Israel
-
 Italy
-
 Jamaica
-
 Japan
-
 Jordan
-
 Kazakhstan
-
 Kenya
-
 Korea
-
 Kuwait
-
 Kyrgyzstan
-
 Laos
-
 Latvia
-
 Lebanon
-
 Lesotho
-
 Libya
-
 Lithuania
-
 Luxembourg
-
 Madagascar
-
 Malaysia
-
 Malta
-
 Mauritius
-
 Mexico
-
 Moldova
-
 Mongolia
-
 Montenegro
-
 Morocco
-
 Mozambique
-
 Myanmar
-
 Namibia
-
 Nepal
-
 Netherlands
-
 New Zealand
-
 Nigeria
-
 North Macedonia
-
 Norway
-
 Oman
-
 Pakistan
-
 Palestine
-
 Panama
-
 Papua New Guinea
-
 Paraguay
-
 Peru
-
 Philippines
-
 Poland
-
 Portugal
-
 Puerto Rico
-
 Qatar
-
 Reunion
-
 Romania
-
 Rwanda
-
 Saudi Arabia
-
 Serbia
-
 Singapore
-
 Slovakia
-
 Slovenia
-
 Somalia
-
 South Africa
-
 Spain
-
 Sri Lanka
-
 Sweden
-
 Switzerland
-
 Syria
-
 Taiwan
-
 Tajikistan
-
 Tanzania
-
 Thailand
-
 Trinidad and Tobago
-
 Tunisia
-
 Turkey
-
 UAE
-
 Uganda
-
 Ukraine
-
 United Kingdom
-
United States
-
 Uruguay
-
 Uzbekistan
-
 Venezuela
-
 Vietnam
-
 Yemen
-
 Zambia
-
 Zimbabwe
- Forex
- Crypto












