

Optimism technical analysis: Weak momentum confirms seller pressure dominates

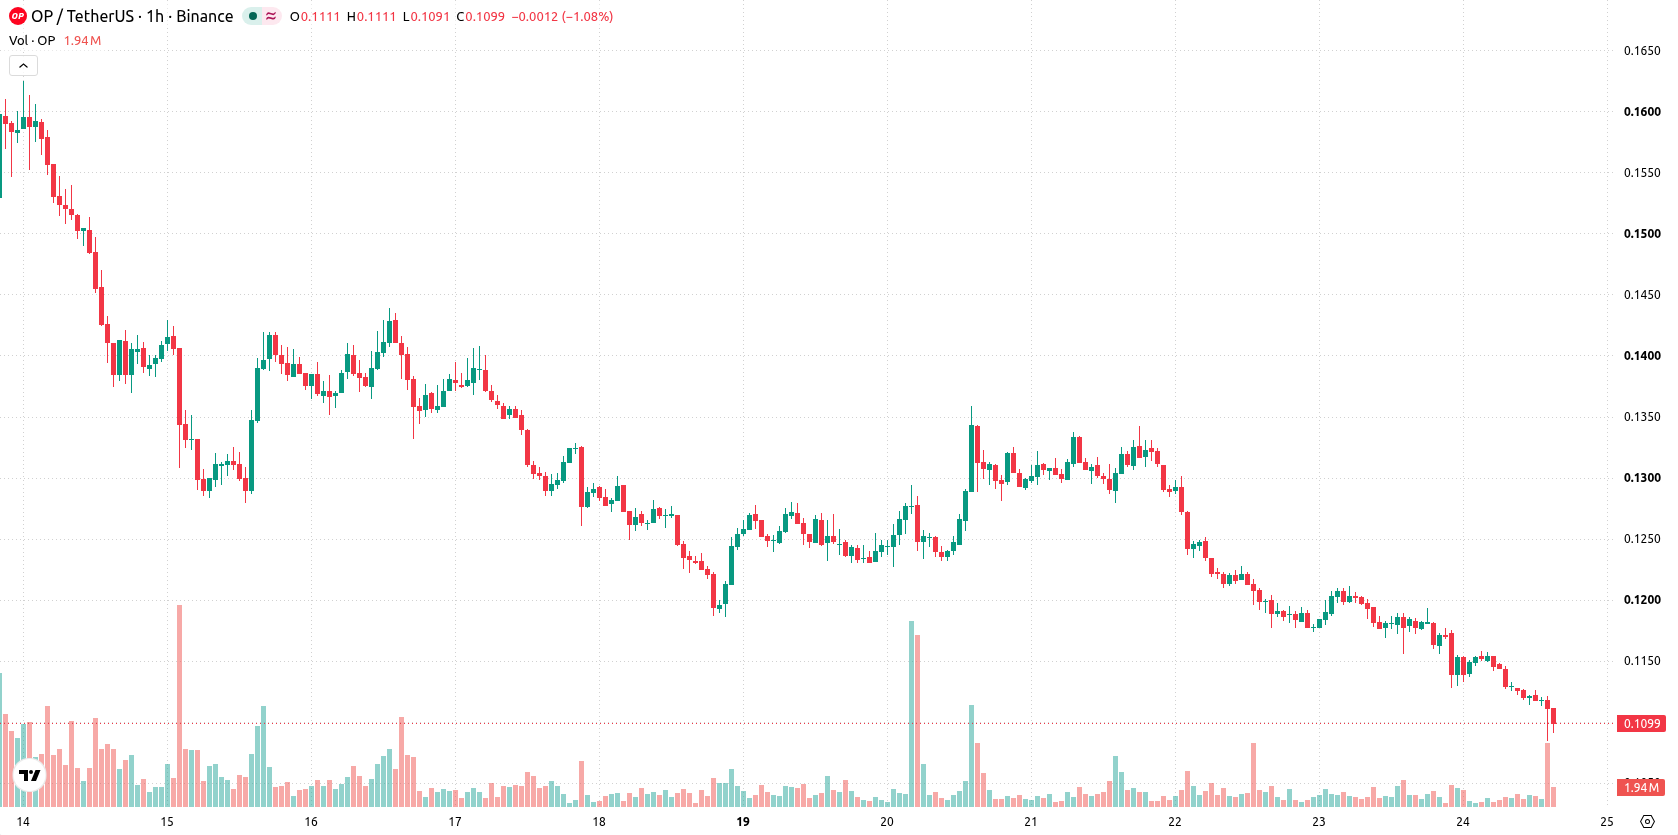
Optimism (OP) is trading at $0.1094, down 7.13% on the day. The price currently sits below its key moving averages, reflecting ongoing downside momentum in the short and medium term.
 0.1167
0.1228
Highlights
- ExactlyProtocol introduced a decentralized credit market with crypto credit card and buy now pay later features on Optimism Mainnet.
- Proposals to enable native Ether transfers and protocol-level integration between OP Mainnet and Unichain remain under review by the Optimism Foundation and Uniswap Labs.
- OP trades below key moving averages and momentum indicators confirm strong selling pressure, with price expected to range from $0.1009 to $0.1146.
Protocol launch and governance reviews drive use case expansion amid selling
ExactlyProtocol launched a decentralized credit market on Optimism Mainnet on October 23, 2026, introducing crypto credit card and buy now, pay later features to the network and expanding on-chain use cases, according to TokenPost. This product launch could drive increased user engagement and utility by offering new avenues for borrowing and spending. Meanwhile, proposals from the Optimism Foundation and Uniswap Labs to enable native Ether transfers between OP Mainnet and Unichain remain under technical and governance review, presenting a potential avenue for broader future interoperability and liquidity expansion. Additional plans for protocol-level integration with Unichain are pending further preparation and approval, though price action has remained under broader selling pressure.
Bearish technical consensus as oversold signals reinforce resistance levels
OP is currently below the MA-20 ($0.114) and MA-50 ($0.117) on the hourly chart, as well as the MA-200 ($0.1125) on the daily timeframe. The Ichimoku Kijun sits at $0.1153, establishing the nearest resistance. Intraday momentum is strongly bearish: MACD and ADX both display Sell signals, while RSI is deeply oversold at 26. Stoch RSI and CCI are also in oversold territory, and Bull/Bear Power favors sellers. The Awesome Oscillator remains neutral, offering no directional confirmation. Price action is marked by a 7.13% decline with a gap down of 0.0025, cementing a consensus of negative bias among key technical indicators.
Downside risk elevated as narrow consolidation band persists
Over the coming sessions, OP is expected to trade within a volatility band between $0.1009 and $0.1146. The probability of an upward move is assessed as very low, while the likelihood of further downside remains high. The baseline scenario envisions price consolidation inside this corridor; a decisive break above the $0.1153 resistance would be required to trigger bullish momentum, while a drop below the $0.1009 level may signal an acceleration of selling and additional downside risk.
Earlier, analysts noted that Optimism faced continued downside risk, with deeply oversold technical conditions and seller dominance remaining the primary narrative. The current article reinforces this bearish outlook, as fresh technical signals confirm sustained negative momentum and highlight the $0.1009 support as a critical level to monitor for signs of renewed selling pressure.










-
 Afghanistan
-
 Albania
-
 Algeria
-
 Angola
-
 Argentina
-
 Armenia
-
 Australia
-
 Austria
-
 Azerbaijan
-
 Bahamas
-
 Bahrain
-
 Bangladesh
-
 Belarus
-
 Belgium
-
 Bolivia
-
 Botswana
-
 Brazil
-
 Brunei
-
 Bulgaria
-
 Cambodia
-
 Cameroon
-
 Canada
-
 Chile
-
 China
-
 Colombia
-
 Congo
-
 Costa Rica
-
 Cote d'Ivoire
-
 Croatia
-
 Cuba
-
 Cyprus
-
 Czechia
-
 DR Congo
-
 Denmark
-
 Dominican Republic
-
 Ecuador
-
 Egypt
-
 El Salvador
-
 Estonia
-
 Eswatini
-
 Ethiopia
-
 Finland
-
 France
-
 Georgia
-
 Germany
-
 Ghana
-
 Greece
-
 Haiti
-
 Hong Kong
-
 Hungary
-
 India
-
 Indonesia
-
 Iran, Islamic republic
-
 Iraq
-
 Ireland
-
 Israel
-
 Italy
-
 Jamaica
-
 Japan
-
 Jordan
-
 Kazakhstan
-
 Kenya
-
 Korea
-
 Kuwait
-
 Kyrgyzstan
-
 Laos
-
 Latvia
-
 Lebanon
-
 Lesotho
-
 Libya
-
 Lithuania
-
 Luxembourg
-
 Madagascar
-
 Malaysia
-
 Malta
-
 Mauritius
-
 Mexico
-
 Moldova
-
 Mongolia
-
 Montenegro
-
 Morocco
-
 Mozambique
-
 Myanmar
-
 Namibia
-
 Nepal
-
 Netherlands
-
 New Zealand
-
 Nigeria
-
 North Macedonia
-
 Norway
-
 Oman
-
 Pakistan
-
 Palestine
-
 Panama
-
 Papua New Guinea
-
 Paraguay
-
 Peru
-
 Philippines
-
 Poland
-
 Portugal
-
 Puerto Rico
-
 Qatar
-
 Reunion
-
 Romania
-
 Rwanda
-
 Saudi Arabia
-
 Serbia
-
 Singapore
-
 Slovakia
-
 Slovenia
-
 Somalia
-
 South Africa
-
 Spain
-
 Sri Lanka
-
 Sweden
-
 Switzerland
-
 Syria
-
 Taiwan
-
 Tajikistan
-
 Tanzania
-
 Thailand
-
 Trinidad and Tobago
-
 Tunisia
-
 Turkey
-
 UAE
-
 Uganda
-
 Ukraine
-
 United Kingdom
-
United States
-
 Uruguay
-
 Uzbekistan
-
 Venezuela
-
 Vietnam
-
 Yemen
-
 Zambia
-
 Zimbabwe
- Forex
- Crypto












