

RAY slides over 10% as bearish signals persist and volume lags

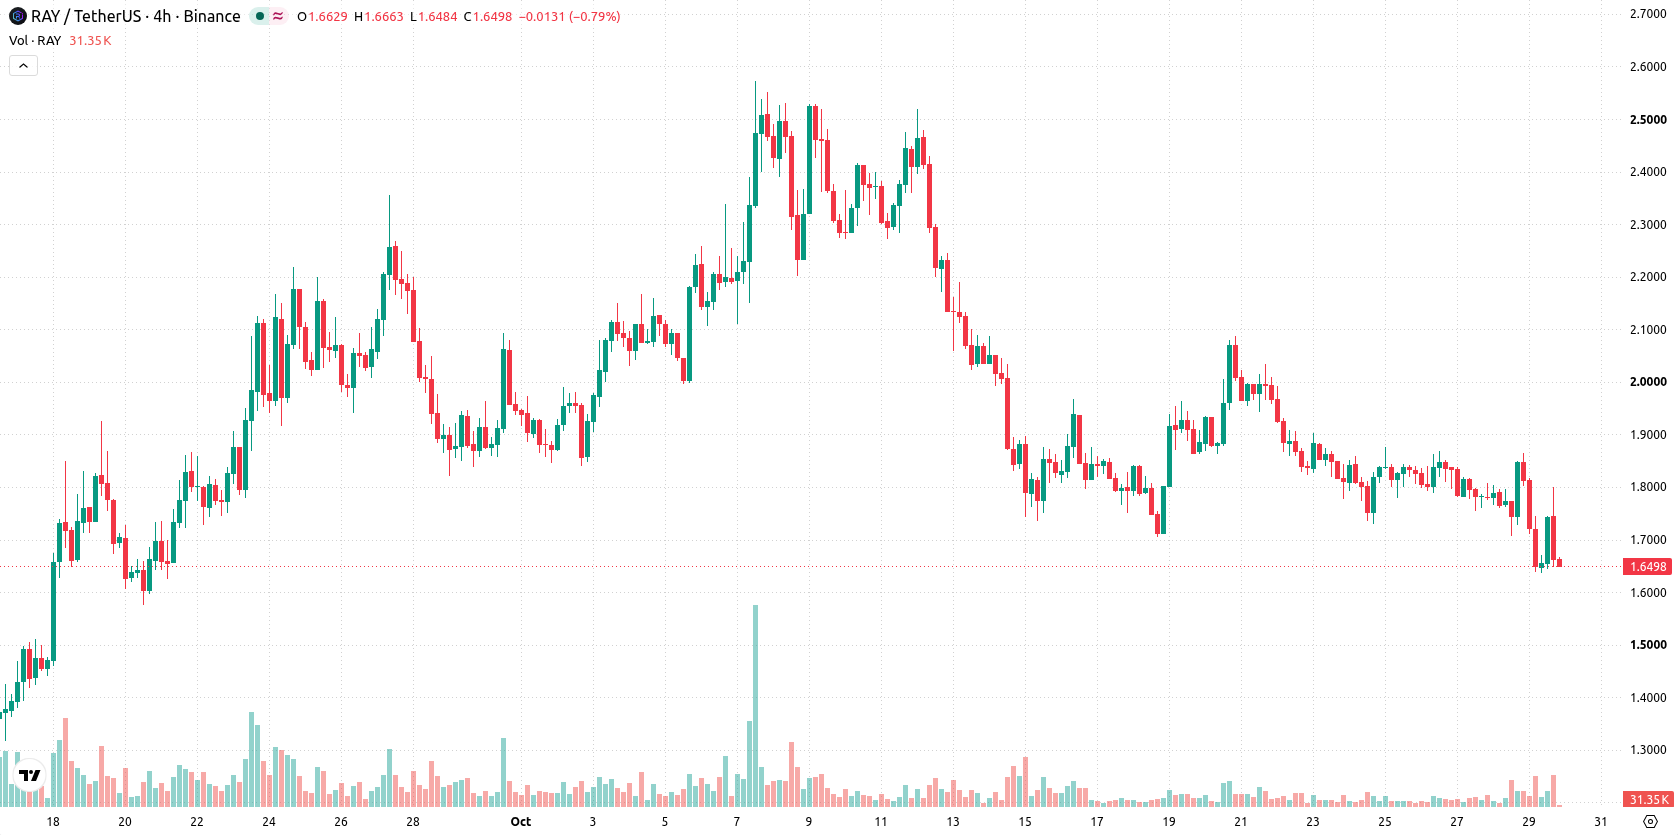
Raydium (RAY) dropped 10.07% as selling pressure grew amid negative momentum signals and subdued trading volumes. The move is supported by the token's position below its 20-day and 50-day moving averages, reinforcing short- and medium-term bearish structure.
 1.6335
1.8649
Highlights
- Raydium trading volumes in late October 2026 dropped to about half of their 30-day average, with no reported incidents or news affecting operations.
- No liquidity events, regulatory changes, or internal developments were identified in connection with the volume decline during the observed period.
- RAY/USD trades below key short- and medium-term moving averages amid persistent selling pressure, with a five-day expected range of $1.5283 to $1.761 and a 59% probability of further downside.
Muted trading and lack of catalysts sustain short-term downside bias
Raydium, the decentralized exchange protocol on Solana, recorded trading volumes at about half its 30-day average in late October 2026. Technical signals indicated short-term weakness during this period, with no confirmed protocol incidents, liquidity events, regulatory actions, or internal company news directly linked to the decline.
Short- and mid-term bearish signals as momentum remains negative
RAY/USD is now trading below its 20-day and 50-day moving averages at $1.9487 and $1.8776, respectively, while staying well above the 200-day at $0.9956. This structure highlights short- and medium-term seller pressure, while the longer-term outlook remains bullish. The nearest support is at $1.6362, with a resistance ceiling at $1.7059. Momentum signals remain broadly negative: MACD and ADX point to a "Sell" bias, while the RSI, CCI, and Stochastic RSI all signal oversold conditions or continued downside momentum. Bull/Bear Power is below zero, and the Awesome Oscillator remains negative, reflecting dominant selling pressure within the current trading session. RAY/USD stands near today's low after slipping 10.07% following a downside gap of nearly 2%, with intraday volatility at 11.11%.
Earlier, analysts noted that Raydium was facing sustained selling pressure and heightened volatility risks due to declining trading volumes and weak technical signals. The current analysis reaffirms this bearish outlook by identifying persistent negative momentum and thin liquidity, with the key support at $1.6362 now serving as the critical level to watch for further downside in the near term.










-
 Afghanistan
-
 Albania
-
 Algeria
-
 Angola
-
 Argentina
-
 Armenia
-
 Australia
-
 Austria
-
 Azerbaijan
-
 Bahamas
-
 Bahrain
-
 Bangladesh
-
 Belarus
-
 Belgium
-
 Bolivia
-
 Botswana
-
 Brazil
-
 Brunei
-
 Bulgaria
-
 Cambodia
-
 Cameroon
-
 Canada
-
 Chile
-
 China
-
 Colombia
-
 Congo
-
 Costa Rica
-
 Cote d'Ivoire
-
 Croatia
-
 Cuba
-
 Cyprus
-
 Czechia
-
 DR Congo
-
 Denmark
-
 Dominican Republic
-
 Ecuador
-
 Egypt
-
 El Salvador
-
 Estonia
-
 Eswatini
-
 Ethiopia
-
 Finland
-
 France
-
 Georgia
-
 Germany
-
 Ghana
-
 Greece
-
 Haiti
-
 Hong Kong
-
 Hungary
-
 India
-
 Indonesia
-
 Iran, Islamic republic
-
 Iraq
-
 Ireland
-
 Israel
-
 Italy
-
 Jamaica
-
 Japan
-
 Jordan
-
 Kazakhstan
-
 Kenya
-
 Korea
-
 Kuwait
-
 Kyrgyzstan
-
 Laos
-
 Latvia
-
 Lebanon
-
 Lesotho
-
 Libya
-
 Lithuania
-
 Luxembourg
-
 Madagascar
-
 Malaysia
-
 Malta
-
 Mauritius
-
 Mexico
-
 Moldova
-
 Mongolia
-
 Montenegro
-
 Morocco
-
 Mozambique
-
 Myanmar
-
 Namibia
-
 Nepal
-
 Netherlands
-
 New Zealand
-
 Nigeria
-
 North Macedonia
-
 Norway
-
 Oman
-
 Pakistan
-
 Palestine
-
 Panama
-
 Papua New Guinea
-
 Paraguay
-
 Peru
-
 Philippines
-
 Poland
-
 Portugal
-
 Puerto Rico
-
 Qatar
-
 Reunion
-
 Romania
-
 Rwanda
-
 Saudi Arabia
-
 Serbia
-
 Singapore
-
 Slovakia
-
 Slovenia
-
 Somalia
-
 South Africa
-
 Spain
-
 Sri Lanka
-
 Sweden
-
 Switzerland
-
 Syria
-
 Taiwan
-
 Tajikistan
-
 Tanzania
-
 Thailand
-
 Trinidad and Tobago
-
 Tunisia
-
 Turkey
-
 UAE
-
 Uganda
-
 Ukraine
-
 United Kingdom
-
United States
-
 Uruguay
-
 Uzbekistan
-
 Venezuela
-
 Vietnam
-
 Yemen
-
 Zambia
-
 Zimbabwe
- Forex
- Crypto












