

SEI declines as sustained seller pressure weighs on market sentiment

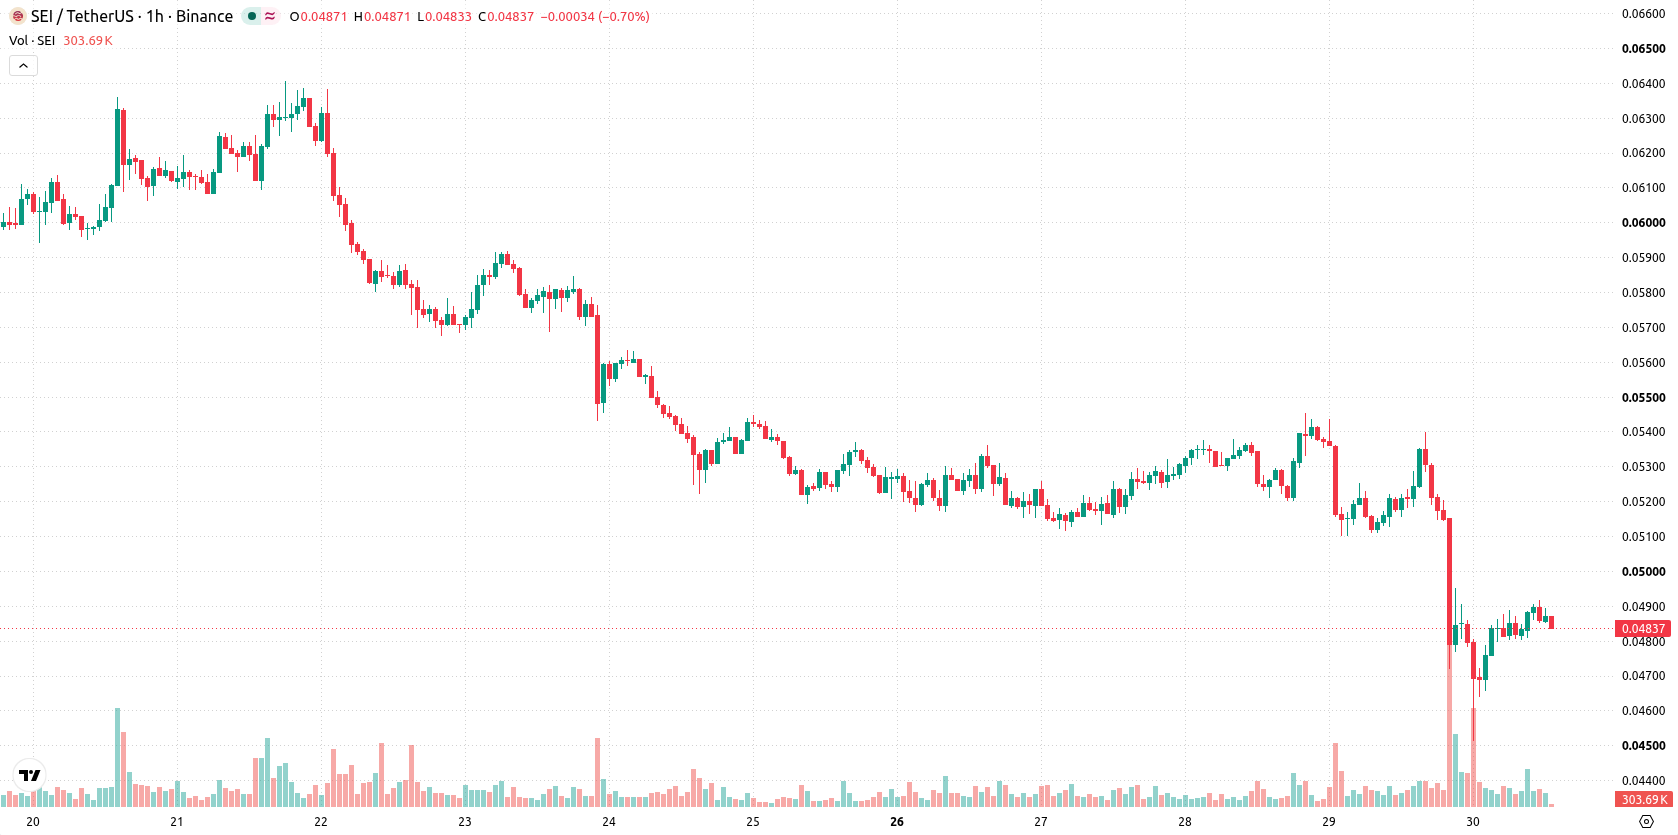
Sei (SEI) is trading at $0.0484, marking a 7.19% decline for the day. The price remains below its key moving averages, indicating sustained downside momentum.
 0.0458
0.0513
Highlights
- SEI/USD trades below key moving averages across timeframes, with price at $0.0484 and down 7.19% for the day.
- Technical indicators show strong negative momentum, with most signals on Sell and only temporary intraday buying attempts.
- Trading is expected within $0.0459 to $0.0505 for the next 2 to 3 days, with downside probability at 70% and $0.0495 as immediate resistance.
Downside momentum as multiple indicators confirm resistance at Kijun
SEI/USD is trading below the MA-20 ($0.0487) and MA-50 ($0.051) on the hourly chart, as well as the MA-200 ($0.0544) on the daily chart. The Ichimoku Kijun sits at $0.0495 and acts as immediate resistance. Momentum indicators remain negative: MACD signals a strong sell, ADX confirms downside pressure, and RSI at 43.5 points to a bearish bias. Stochastic RSI shows overbought conditions, while CCI is neutral—signaling some divergence among oscillators. Bull/Bear Power stands on a strong buy, revealing intraday buying attempts. Awesome Oscillator is neutral and does not reinforce the dominant trend.
Downside risk persists amid consolidation and limited upside triggers
For the next 2–3 trading days, SEI is expected to hold within a volatile range between $0.0459 and $0.0505. There is a 70% probability of further downside, with only a 30% chance of an upward reversal. The baseline scenario favors continued consolidation at current levels. A move above $0.0495 resistance would be required for a bullish shift, while a drop below $0.0459 support would likely trigger additional selling.
Earlier, analysts noted that Sei was under persistent downward pressure as technical indicators broadly supported a bearish outlook. The current analysis adds nuance with mixed momentum signals and intraday buying attempts, making the $0.0495 resistance and $0.0459 support crucial levels for traders to monitor in the coming sessions.










-
 Afghanistan
-
 Albania
-
 Algeria
-
 Angola
-
 Argentina
-
 Armenia
-
 Australia
-
 Austria
-
 Azerbaijan
-
 Bahamas
-
 Bahrain
-
 Bangladesh
-
 Belarus
-
 Belgium
-
 Bolivia
-
 Botswana
-
 Brazil
-
 Brunei
-
 Bulgaria
-
 Cambodia
-
 Cameroon
-
 Canada
-
 Chile
-
 China
-
 Colombia
-
 Congo
-
 Costa Rica
-
 Cote d'Ivoire
-
 Croatia
-
 Cuba
-
 Cyprus
-
 Czechia
-
 DR Congo
-
 Denmark
-
 Dominican Republic
-
 Ecuador
-
 Egypt
-
 El Salvador
-
 Estonia
-
 Eswatini
-
 Ethiopia
-
 Finland
-
 France
-
 Georgia
-
 Germany
-
 Ghana
-
 Greece
-
 Haiti
-
 Hong Kong
-
 Hungary
-
 India
-
 Indonesia
-
 Iran, Islamic republic
-
 Iraq
-
 Ireland
-
 Israel
-
 Italy
-
 Jamaica
-
 Japan
-
 Jordan
-
 Kazakhstan
-
 Kenya
-
 Korea
-
 Kuwait
-
 Kyrgyzstan
-
 Laos
-
 Latvia
-
 Lebanon
-
 Lesotho
-
 Libya
-
 Lithuania
-
 Luxembourg
-
 Madagascar
-
 Malaysia
-
 Malta
-
 Mauritius
-
 Mexico
-
 Moldova
-
 Mongolia
-
 Montenegro
-
 Morocco
-
 Mozambique
-
 Myanmar
-
 Namibia
-
 Nepal
-
 Netherlands
-
 New Zealand
-
 Nigeria
-
 North Macedonia
-
 Norway
-
 Oman
-
 Pakistan
-
 Palestine
-
 Panama
-
 Papua New Guinea
-
 Paraguay
-
 Peru
-
 Philippines
-
 Poland
-
 Portugal
-
 Puerto Rico
-
 Qatar
-
 Reunion
-
 Romania
-
 Rwanda
-
 Saudi Arabia
-
 Serbia
-
 Singapore
-
 Slovakia
-
 Slovenia
-
 Somalia
-
 South Africa
-
 Spain
-
 Sri Lanka
-
 Sweden
-
 Switzerland
-
 Syria
-
 Taiwan
-
 Tajikistan
-
 Tanzania
-
 Thailand
-
 Trinidad and Tobago
-
 Tunisia
-
 Turkey
-
 UAE
-
 Uganda
-
 Ukraine
-
 United Kingdom
-
United States
-
 Uruguay
-
 Uzbekistan
-
 Venezuela
-
 Vietnam
-
 Yemen
-
 Zambia
-
 Zimbabwe
- Forex
- Crypto












