

Sei price forecast: Downside risks persist below key moving averages

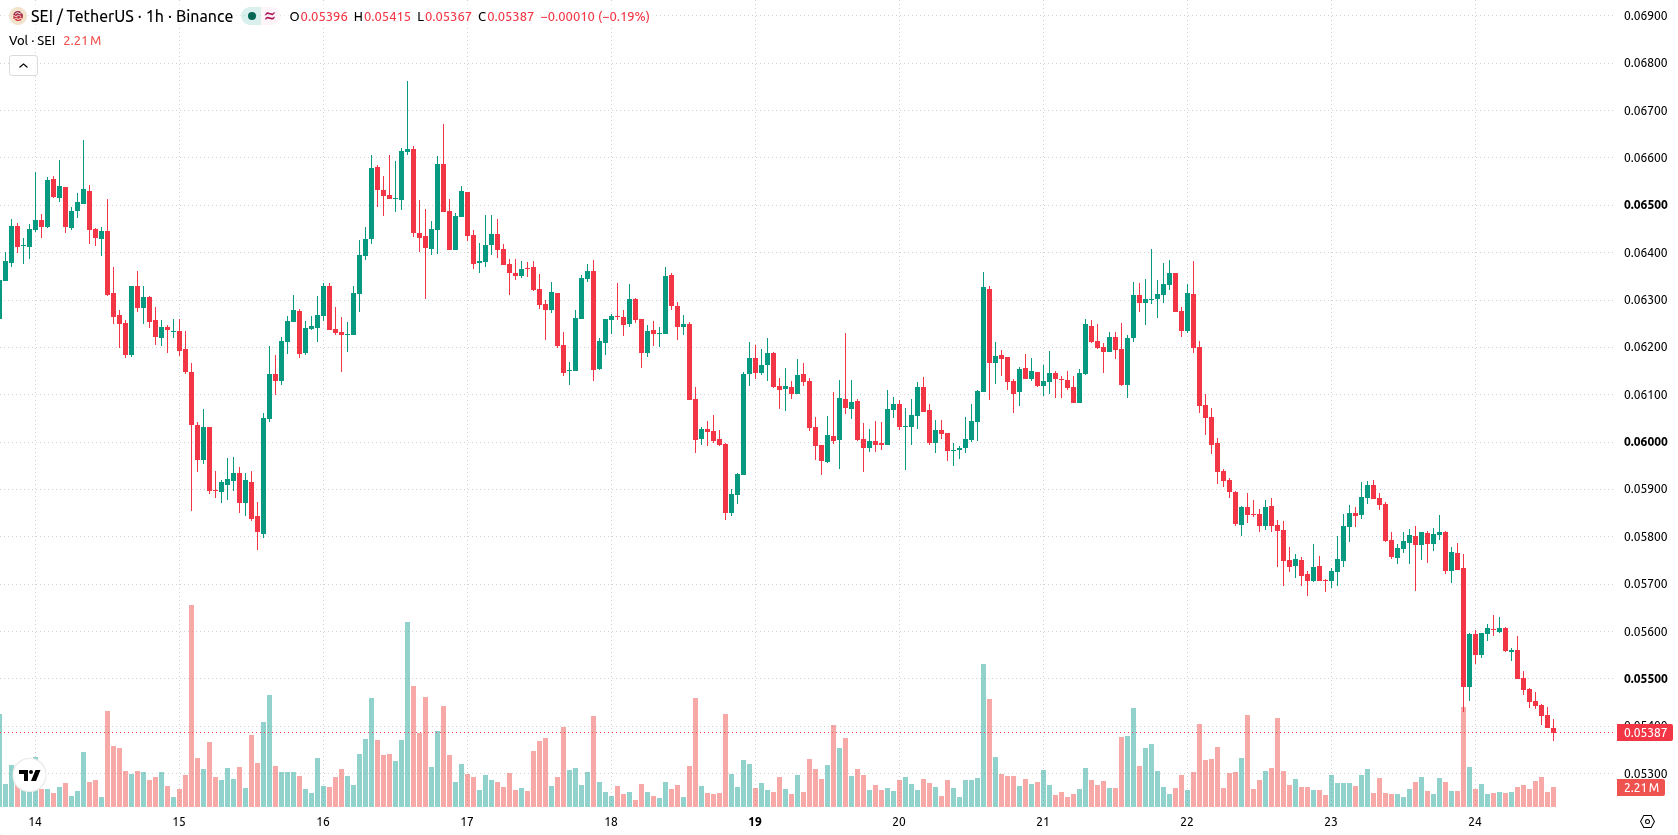
Sei (SEI) is trading at $0.0539, posting a daily loss of 7.16%. The asset remains below its key moving averages, signaling sustained downward momentum.
 0.049
0.0545
Highlights
- SEI/USD trades below key moving averages, reinforcing sustained downward pressure across both short- and long-term trends.
- Momentum indicators confirm decisive bearish conditions with the price at $0.0539, down 7.16% and near session lows.
- Expected 2 to 3 day trading range is $0.0514 to $0.0561; probability of further decline is very high and upward reversal is very unlikely.
Bearish momentum reinforced as technical signals show oversold stretch
Technically, SEI/USD is trading below the MA-20, MA-50, and MA-200, which indicates persistent downward pressure in both short- and long-term windows. The Ichimoku Kijun level is positioned at $0.0562, providing immediate resistance for any attempted rallies. Intraday momentum remains notably bearish, with MACD and ADX both highlighting robust downside momentum. The RSI indicates deep oversold levels, further confirmed by Stoch RSI and CCI, which both signal oversold conditions. Bull/Bear Power continues to show seller dominance across the session, and the Awesome Oscillator (AO) also supports the prevailing bearish trend. Price action remains near today's low amid pronounced volatility, without signs of a short-term recovery.
Downside outlook persists as reversal probability remains low
Over the next two to three trading days, SEI/USD is expected to move within a band of $0.0514 to $0.0561, reflecting typical volatility at current levels. The probability of a material upward move is rated very low, with continued downside remaining the most likely scenario. A sustained break above $0.0562 would signal a potential reversal and challenge immediate resistance, while a decisive drop below $0.0514 may accelerate further losses.
Earlier, analysts noted that Sei was under persistent downside pressure despite some signs of long-term support. The current analysis reinforces this bearish outlook, with traders advised to closely monitor price action near $0.0514 for any potential acceleration in downward momentum.










-
 Afghanistan
-
 Albania
-
 Algeria
-
 Angola
-
 Argentina
-
 Armenia
-
 Australia
-
 Austria
-
 Azerbaijan
-
 Bahamas
-
 Bahrain
-
 Bangladesh
-
 Belarus
-
 Belgium
-
 Bolivia
-
 Botswana
-
 Brazil
-
 Brunei
-
 Bulgaria
-
 Cambodia
-
 Cameroon
-
 Canada
-
 Chile
-
 China
-
 Colombia
-
 Congo
-
 Costa Rica
-
 Cote d'Ivoire
-
 Croatia
-
 Cuba
-
 Cyprus
-
 Czechia
-
 DR Congo
-
 Denmark
-
 Dominican Republic
-
 Ecuador
-
 Egypt
-
 El Salvador
-
 Estonia
-
 Eswatini
-
 Ethiopia
-
 Finland
-
 France
-
 Georgia
-
 Germany
-
 Ghana
-
 Greece
-
 Haiti
-
 Hong Kong
-
 Hungary
-
 India
-
 Indonesia
-
 Iran, Islamic republic
-
 Iraq
-
 Ireland
-
 Israel
-
 Italy
-
 Jamaica
-
 Japan
-
 Jordan
-
 Kazakhstan
-
 Kenya
-
 Korea
-
 Kuwait
-
 Kyrgyzstan
-
 Laos
-
 Latvia
-
 Lebanon
-
 Lesotho
-
 Libya
-
 Lithuania
-
 Luxembourg
-
 Madagascar
-
 Malaysia
-
 Malta
-
 Mauritius
-
 Mexico
-
 Moldova
-
 Mongolia
-
 Montenegro
-
 Morocco
-
 Mozambique
-
 Myanmar
-
 Namibia
-
 Nepal
-
 Netherlands
-
 New Zealand
-
 Nigeria
-
 North Macedonia
-
 Norway
-
 Oman
-
 Pakistan
-
 Palestine
-
 Panama
-
 Papua New Guinea
-
 Paraguay
-
 Peru
-
 Philippines
-
 Poland
-
 Portugal
-
 Puerto Rico
-
 Qatar
-
 Reunion
-
 Romania
-
 Rwanda
-
 Saudi Arabia
-
 Serbia
-
 Singapore
-
 Slovakia
-
 Slovenia
-
 Somalia
-
 South Africa
-
 Spain
-
 Sri Lanka
-
 Sweden
-
 Switzerland
-
 Syria
-
 Taiwan
-
 Tajikistan
-
 Tanzania
-
 Thailand
-
 Trinidad and Tobago
-
 Tunisia
-
 Turkey
-
 UAE
-
 Uganda
-
 Ukraine
-
 United Kingdom
-
United States
-
 Uruguay
-
 Uzbekistan
-
 Venezuela
-
 Vietnam
-
 Yemen
-
 Zambia
-
 Zimbabwe
- Forex
- Crypto












