

Will SEI avoid deeper losses amid strong downward price move?

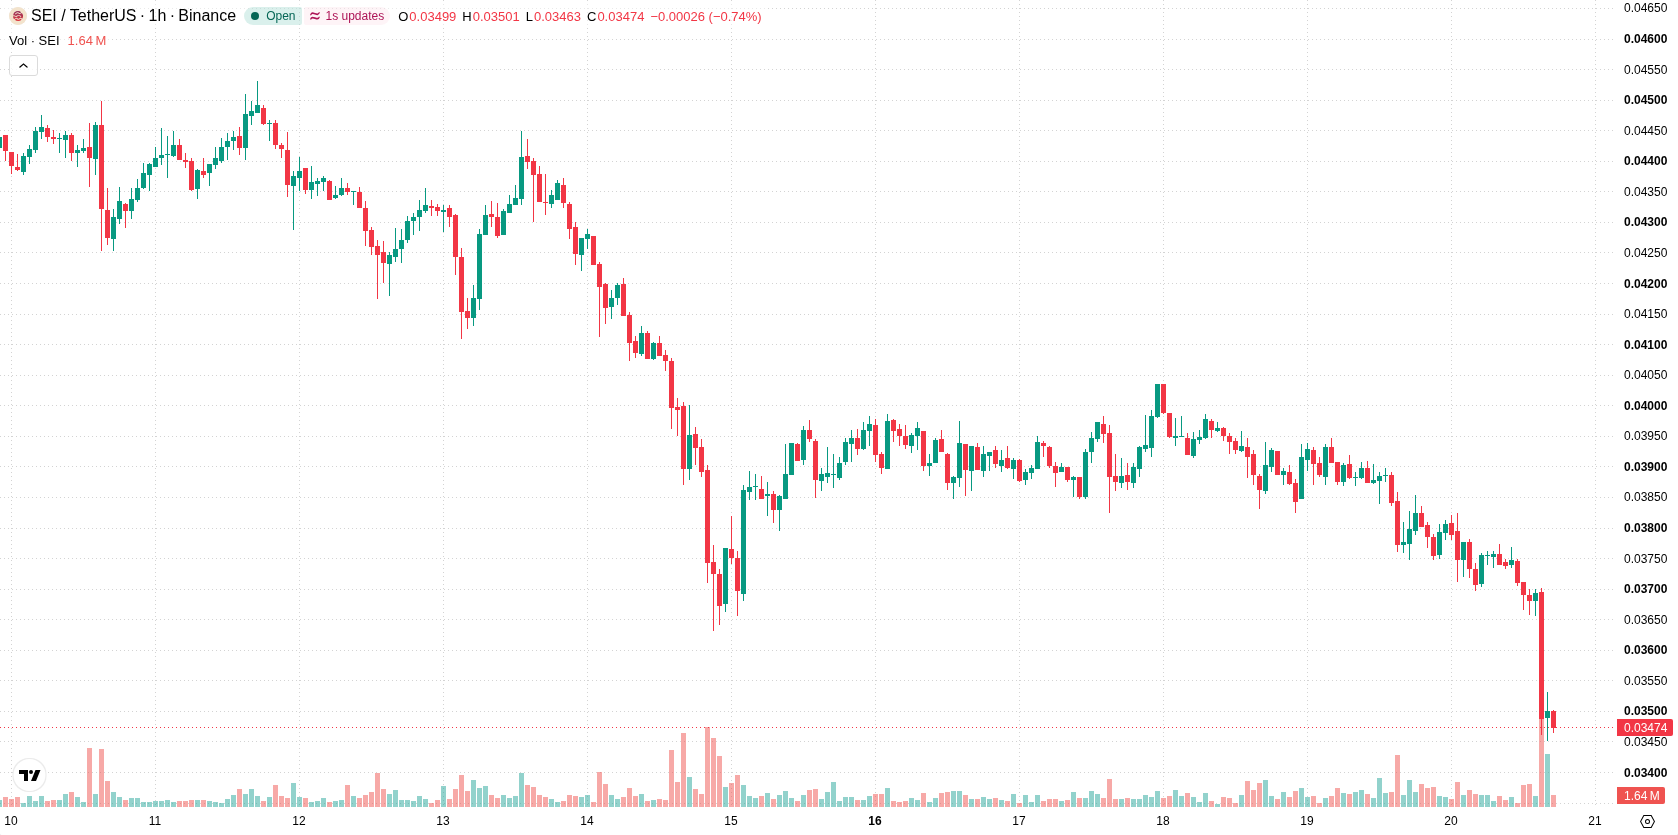
Sei (SEI) is trading at $0.0348, down 7.55% on the day in a highly volatile session. The price remains below its key short-, medium-, and long-term moving averages, reflecting sustained downward pressure from sellers.
 0.0382
0.0429
Highlights
- SEI can now be sent, received, and spent through the Binance app after its integration with Binance Pay, expanding transactional utility.
- SEI payments are supported at millions of payment points in Korea via TMO Labs and Binance Pay, broadening global digital payments use.
- SEI/USD trades below key moving averages and major indicators confirm a strong downtrend, with price expected to consolidate between $0.0301 to $0.0363 and high probability of further declines short term.
Payment ecosystem expansion as integration fails to offset selling pressure
Sei Network’s recent integration with Binance Pay, which allows users to send, receive, and spend SEI directly through the Binance app, was confirmed by Cryptonews. This integration broadens SEI’s transactional utility by embedding it into a widely used payment ecosystem, potentially increasing organic demand over time. Additional support for SEI payments globally via Binance Pay, together with TMO Labs integrating SEI at millions of payment points in Korea as reported by Coin Turk, extends the crypto’s practical use case in the digital payments space, though price action has remained under broader selling pressure.
Bearish momentum persists as oversold indicators underscore technical barriers
SEI/USD is trading below H1 SMA-20 at $0.0372, H1 SMA-50 at $0.0381, and D1 SMA-200 at $0.0528. The Ichimoku Kijun at $0.0365 is acting as immediate resistance. MACD and ADX both signal continued selling momentum, while the RSI, Stoch RSI, and CCI each remain in their respective oversold zones—typically a sign of strong downward extension, though not a guarantee of reversal. Bull/Bear Power is negative, confirming sellers' dominance intraday, and the Awesome Oscillator indicates that the prevailing downtrend remains intact.
Range-bound outlook as downside risk dominates immediate forecast
In the short term, the expected trading range for SEI/USD is $0.0301 to $0.0363, in line with current volatility. The probability of an upward move is considered very low, while the likelihood of a further decline is high, making a reversal less likely in the immediate horizon. The base case scenario is sideways consolidation within the forecast band; a breakout above resistance would be required to shift sentiment, while a fall below support could reinforce bearish momentum.
Earlier, analysts noted that Sei faced mixed technical signals and a predominantly range-bound outlook, with downside risks outweighing the chances of a bullish reversal. The current assessment reinforces this bearish bias given continued selling momentum and oversold conditions, highlighting $0.0365 as a pivotal level that may determine whether further declines or a phase of stabilization emerges in the near term.










-
 Afghanistan
-
 Albania
-
 Algeria
-
 Angola
-
 Argentina
-
 Armenia
-
 Australia
-
 Austria
-
 Azerbaijan
-
 Bahamas
-
 Bahrain
-
 Bangladesh
-
 Belarus
-
 Belgium
-
 Bolivia
-
 Botswana
-
 Brazil
-
 Brunei
-
 Bulgaria
-
 Cambodia
-
 Cameroon
-
 Canada
-
 Chile
-
 China
-
 Colombia
-
 Congo
-
 Costa Rica
-
 Cote d'Ivoire
-
 Croatia
-
 Cuba
-
 Cyprus
-
 Czechia
-
 DR Congo
-
 Denmark
-
 Dominican Republic
-
 Ecuador
-
 Egypt
-
 El Salvador
-
 Estonia
-
 Eswatini
-
 Ethiopia
-
 Finland
-
 France
-
 Georgia
-
 Germany
-
 Ghana
-
 Greece
-
 Haiti
-
 Hong Kong
-
 Hungary
-
 India
-
 Indonesia
-
 Iran, Islamic republic
-
 Iraq
-
 Ireland
-
 Israel
-
 Italy
-
 Jamaica
-
 Japan
-
 Jordan
-
 Kazakhstan
-
 Kenya
-
 Korea
-
 Kuwait
-
 Kyrgyzstan
-
 Laos
-
 Latvia
-
 Lebanon
-
 Lesotho
-
 Libya
-
 Lithuania
-
 Luxembourg
-
 Madagascar
-
 Malaysia
-
 Malta
-
 Mauritius
-
 Mexico
-
 Moldova
-
 Mongolia
-
 Montenegro
-
 Morocco
-
 Mozambique
-
 Myanmar
-
 Namibia
-
 Nepal
-
 Netherlands
-
 New Zealand
-
 Nigeria
-
 North Macedonia
-
 Norway
-
 Oman
-
 Pakistan
-
 Palestine
-
 Panama
-
 Papua New Guinea
-
 Paraguay
-
 Peru
-
 Philippines
-
 Poland
-
 Portugal
-
 Puerto Rico
-
 Qatar
-
 Reunion
-
 Romania
-
 Rwanda
-
 Saudi Arabia
-
 Serbia
-
 Singapore
-
 Slovakia
-
 Slovenia
-
 Somalia
-
 South Africa
-
 Spain
-
 Sri Lanka
-
 Sweden
-
 Switzerland
-
 Syria
-
 Taiwan
-
 Tajikistan
-
 Tanzania
-
 Thailand
-
 Trinidad and Tobago
-
 Tunisia
-
 Turkey
-
 UAE
-
 Uganda
-
 Ukraine
-
 United Kingdom
-
United States
-
 Uruguay
-
 Uzbekistan
-
 Venezuela
-
 Vietnam
-
 Yemen
-
 Zambia
-
 Zimbabwe
- Forex
- Crypto












