

Sei falls amid continued bearish pressure and limited recovery potential

Sei (SEI) is trading at $0.04, down 8.41% on the day. The price is positioned below its key moving averages, reflecting ongoing downside momentum.
 0.0429
0.0458
Highlights
- Sei Network has maintained over 10,000 daily transactions for 74 days, indicating robust ongoing user participation.
- Transaction activity supports liquidity and ecosystem growth, but SEI price remains under widespread selling pressure.
- SEI/USD trades near $0.04, with technical signals confirming strong bearish momentum and an expected range of $0.0365 to $0.0411 for the coming days.
Sustained network activity supports ecosystem despite selling pressure
Sei Network has demonstrated operational resilience with 74 straight days of surpassing 10,000 daily network transactions, according to Tronweekly. This period of sustained activity highlights ongoing user engagement and indicates demand for the blockchain's infrastructure. While this provides a supportive backdrop for liquidity and ecosystem development, price action has remained under broader selling pressure.
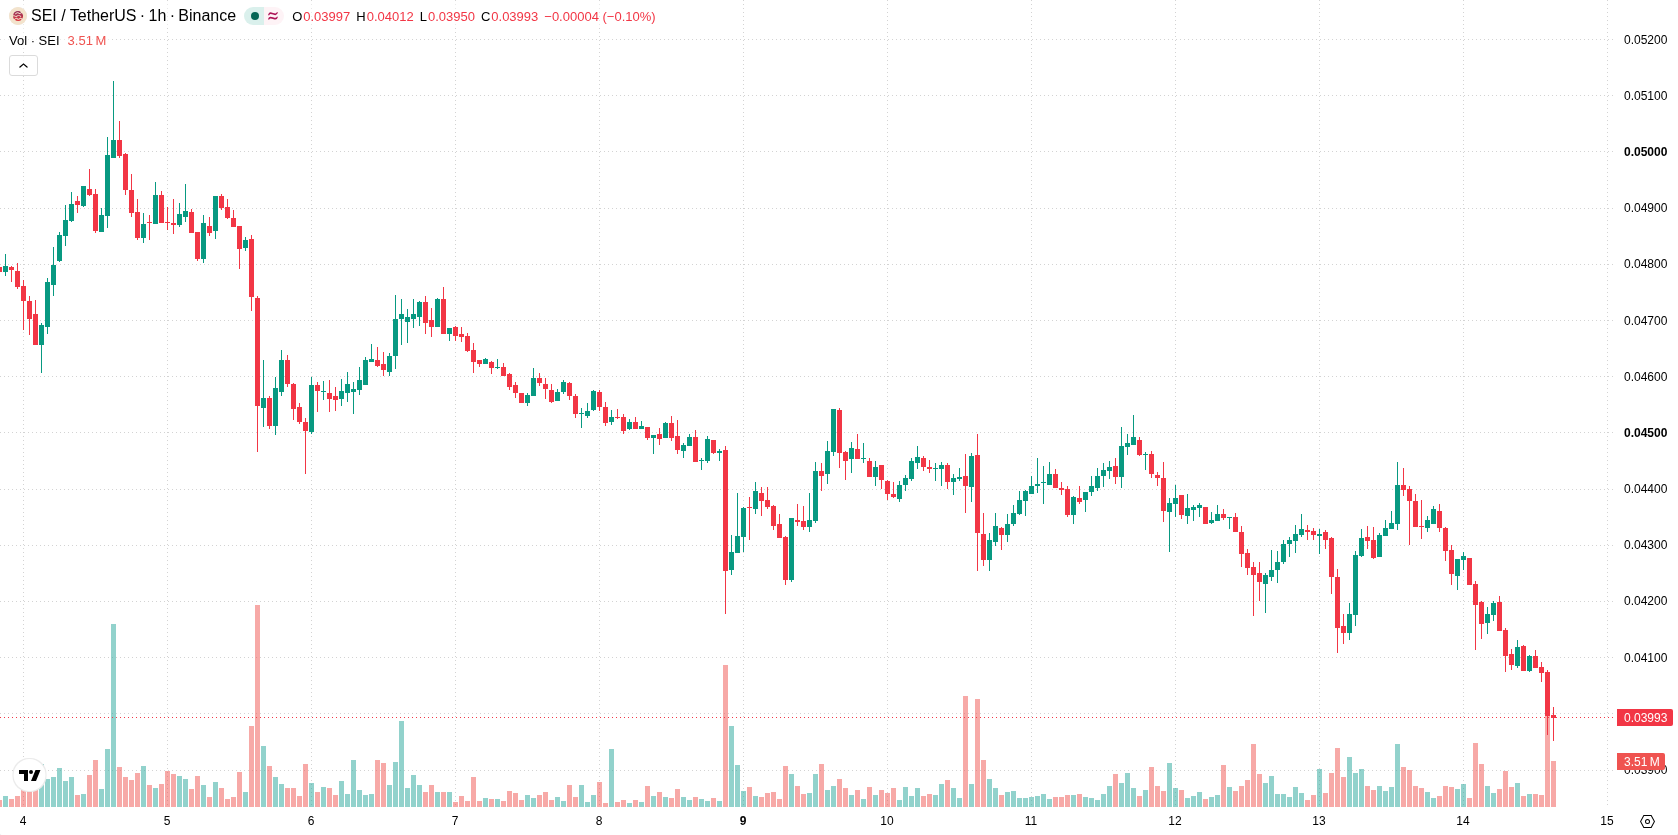
Bearish signals strengthen as price fails key technical levels
On the hourly chart, SEI/USD is trading below the MA-20 at $0.0418 and MA-50 at $0.0425, with the daily MA-200 at $0.0534 above current levels. Immediate resistance is identified at the Ichimoku Kijun level near $0.0423, while support is seen around $0.0365. Momentum indicators confirm strong bearish pressure: MACD and ADX maintain sell signals, the hourly RSI, Stochastic RSI, and CCI all remain in their respective oversold zones, and Bull/Bear Power is negative. The Awesome Oscillator also signals persistent downside momentum, aligning with high intraday volatility.
High risk of further declines pending support level breach
In the short term, SEI/USD is expected to remain within a range of $0.0365 to $0.0411 over the next two to three trading days. The probability of further downside is very high, while a meaningful rebound is considered unlikely unless the price breaks above the immediate resistance at $0.0423. A bearish scenario would be triggered by a close below the $0.0365 support level, increasing the risk of deeper declines.
Earlier, analysts noted that Sei was experiencing persistent bearish momentum, with technical indicators supporting further downside risks. The current analysis reinforces this view, as ongoing selling pressure and strong bearish signals make a break below the $0.0365 support level a critical downside risk for traders to watch.






Latest Sei News




-
 Afghanistan
-
 Albania
-
 Algeria
-
 Angola
-
 Argentina
-
 Armenia
-
 Australia
-
 Austria
-
 Azerbaijan
-
 Bahamas
-
 Bahrain
-
 Bangladesh
-
 Belarus
-
 Belgium
-
 Bolivia
-
 Botswana
-
 Brazil
-
 Brunei
-
 Bulgaria
-
 Cambodia
-
 Cameroon
-
 Canada
-
 Chile
-
 China
-
 Colombia
-
 Congo
-
 Costa Rica
-
 Cote d'Ivoire
-
 Croatia
-
 Cuba
-
 Cyprus
-
 Czechia
-
 DR Congo
-
 Denmark
-
 Dominican Republic
-
 Ecuador
-
 Egypt
-
 El Salvador
-
 Estonia
-
 Eswatini
-
 Ethiopia
-
 Finland
-
 France
-
 Georgia
-
 Germany
-
 Ghana
-
 Greece
-
 Haiti
-
 Hong Kong
-
 Hungary
-
 India
-
 Indonesia
-
 Iran, Islamic republic
-
 Iraq
-
 Ireland
-
 Israel
-
 Italy
-
 Jamaica
-
 Japan
-
 Jordan
-
 Kazakhstan
-
 Kenya
-
 Korea
-
 Kuwait
-
 Kyrgyzstan
-
 Laos
-
 Latvia
-
 Lebanon
-
 Lesotho
-
 Libya
-
 Lithuania
-
 Luxembourg
-
 Madagascar
-
 Malaysia
-
 Malta
-
 Mauritius
-
 Mexico
-
 Moldova
-
 Mongolia
-
 Montenegro
-
 Morocco
-
 Mozambique
-
 Myanmar
-
 Namibia
-
 Nepal
-
 Netherlands
-
 New Zealand
-
 Nigeria
-
 North Macedonia
-
 Norway
-
 Oman
-
 Pakistan
-
 Palestine
-
 Panama
-
 Papua New Guinea
-
 Paraguay
-
 Peru
-
 Philippines
-
 Poland
-
 Portugal
-
 Puerto Rico
-
 Qatar
-
 Reunion
-
 Romania
-
 Rwanda
-
 Saudi Arabia
-
 Serbia
-
 Singapore
-
 Slovakia
-
 Slovenia
-
 Somalia
-
 South Africa
-
 Spain
-
 Sri Lanka
-
 Sweden
-
 Switzerland
-
 Syria
-
 Taiwan
-
 Tajikistan
-
 Tanzania
-
 Thailand
-
 Trinidad and Tobago
-
 Tunisia
-
 Turkey
-
 UAE
-
 Uganda
-
 Ukraine
-
 United Kingdom
-
United States
-
 Uruguay
-
 Uzbekistan
-
 Venezuela
-
 Vietnam
-
 Yemen
-
 Zambia
-
 Zimbabwe
- Forex
- Crypto












