

What's behind Sei's latest 10.4% price pullback?

Sei (SEI) fell 10.39% today as persistent selling pressure and mixed momentum signals indicated ongoing uncertainty about the asset's direction. The downside move is supported by SEI trading below its 20-day and 50-day moving averages, with only long-term support from the 200-day moving average limiting further losses.
 0.047
0.0545
Highlights
- SEI/USD trades below short- and medium-term moving averages but remains above long-term support, with selling pressure prevailing.
- Momentum and oscillator signals are mixed, with most indicators skewed to the downside and volatility at 10%.
- Over the next five days, SEI/USD is expected to range between $0.0528 and $0.062 with sideways consolidation favored.
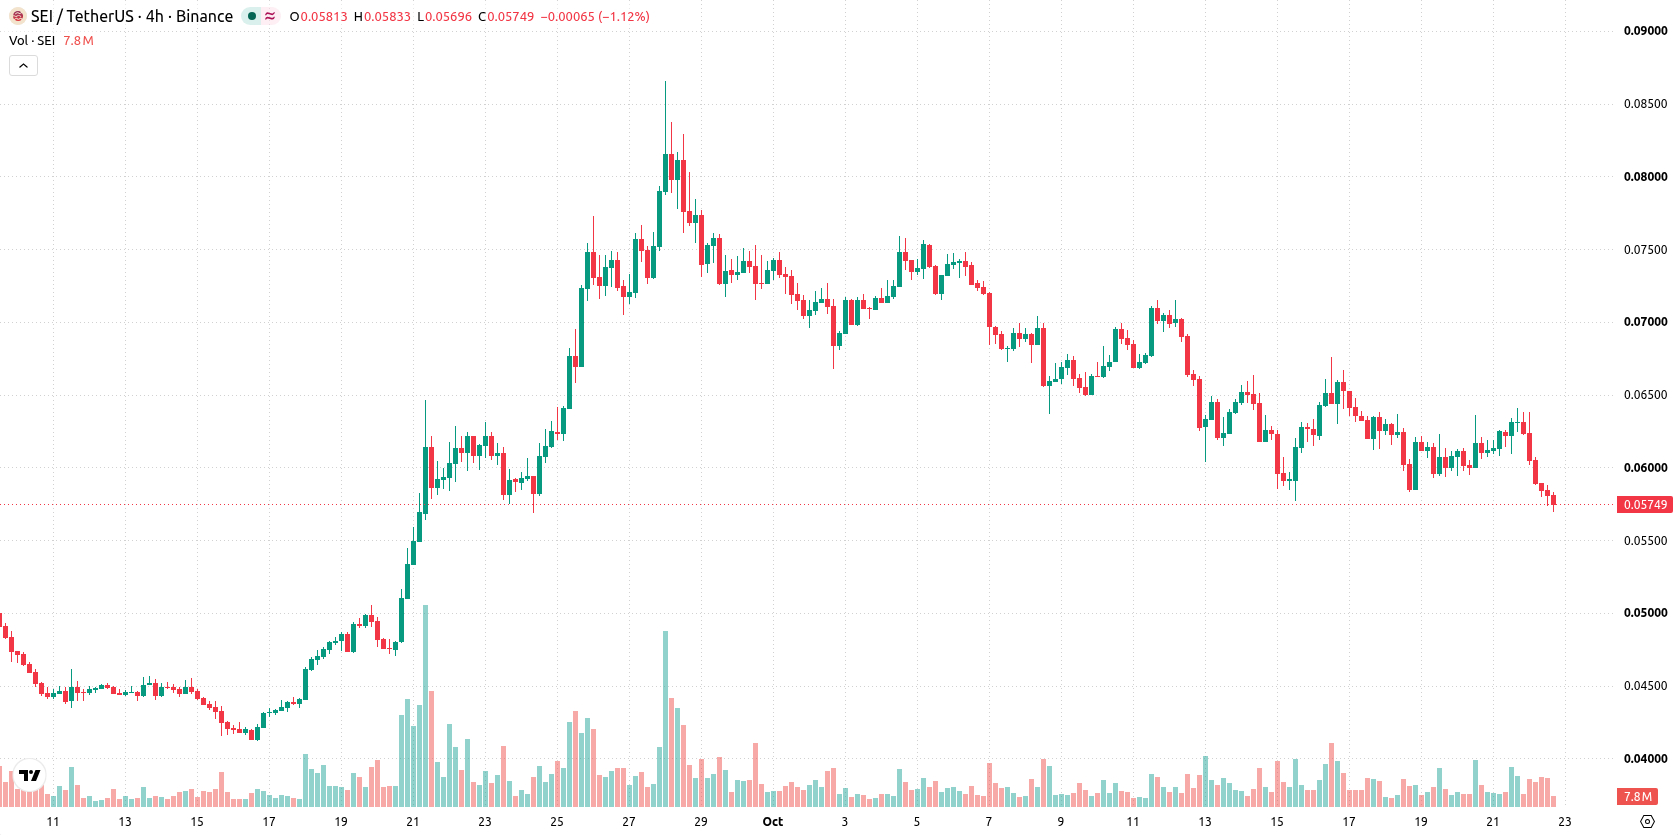
Support holds despite mixed momentum as long-term trend persists
SEI/USD is trading below both the 20-day ($0.0664) and 50-day ($0.0596) moving averages, while remaining just above the 200-day moving average at $0.0544. This setup signals continued short- and medium-term selling pressure, but the bullish arrangement of the 50-day versus 200-day average leaves long-term structural support intact. The Ichimoku Kijun at $0.0722 remains far overhead, underscoring the distant nature of bullish confirmation. The nearest resistance stands at $0.058, with the immediate support at the 200-day moving average ($0.0544). Momentum indicators are mixed: the MACD is slightly negative and neutral, the RSI at 49.11 and CCI at -67.19 each send sell signals, while the ADX points to a potentially strengthening trend. The Stochastic RSI is neutral near 31, and BBP just above zero suggests a modest intraday buyer advantage. However, the Awesome Oscillator remains negative, reflecting prevailing downside momentum.
Earlier, analysts noted that Sei was exhibiting persistent bearish momentum despite signs of network growth and increased adoption. The current analysis affirms this ongoing downside pressure, with traders advised to monitor the $0.0544 support level as a potential pivot point for any shift in the asset’s short-term trajectory.










-
 Afghanistan
-
 Albania
-
 Algeria
-
 Angola
-
 Argentina
-
 Armenia
-
 Australia
-
 Austria
-
 Azerbaijan
-
 Bahamas
-
 Bahrain
-
 Bangladesh
-
 Belarus
-
 Belgium
-
 Bolivia
-
 Botswana
-
 Brazil
-
 Brunei
-
 Bulgaria
-
 Cambodia
-
 Cameroon
-
 Canada
-
 Chile
-
 China
-
 Colombia
-
 Congo
-
 Costa Rica
-
 Cote d'Ivoire
-
 Croatia
-
 Cuba
-
 Cyprus
-
 Czechia
-
 DR Congo
-
 Denmark
-
 Dominican Republic
-
 Ecuador
-
 Egypt
-
 El Salvador
-
 Estonia
-
 Eswatini
-
 Ethiopia
-
 Finland
-
 France
-
 Georgia
-
 Germany
-
 Ghana
-
 Greece
-
 Haiti
-
 Hong Kong
-
 Hungary
-
 India
-
 Indonesia
-
 Iran, Islamic republic
-
 Iraq
-
 Ireland
-
 Israel
-
 Italy
-
 Jamaica
-
 Japan
-
 Jordan
-
 Kazakhstan
-
 Kenya
-
 Korea
-
 Kuwait
-
 Kyrgyzstan
-
 Laos
-
 Latvia
-
 Lebanon
-
 Lesotho
-
 Libya
-
 Lithuania
-
 Luxembourg
-
 Madagascar
-
 Malaysia
-
 Malta
-
 Mauritius
-
 Mexico
-
 Moldova
-
 Mongolia
-
 Montenegro
-
 Morocco
-
 Mozambique
-
 Myanmar
-
 Namibia
-
 Nepal
-
 Netherlands
-
 New Zealand
-
 Nigeria
-
 North Macedonia
-
 Norway
-
 Oman
-
 Pakistan
-
 Palestine
-
 Panama
-
 Papua New Guinea
-
 Paraguay
-
 Peru
-
 Philippines
-
 Poland
-
 Portugal
-
 Puerto Rico
-
 Qatar
-
 Reunion
-
 Romania
-
 Rwanda
-
 Saudi Arabia
-
 Serbia
-
 Singapore
-
 Slovakia
-
 Slovenia
-
 Somalia
-
 South Africa
-
 Spain
-
 Sri Lanka
-
 Sweden
-
 Switzerland
-
 Syria
-
 Taiwan
-
 Tajikistan
-
 Tanzania
-
 Thailand
-
 Trinidad and Tobago
-
 Tunisia
-
 Turkey
-
 UAE
-
 Uganda
-
 Ukraine
-
 United Kingdom
-
United States
-
 Uruguay
-
 Uzbekistan
-
 Venezuela
-
 Vietnam
-
 Yemen
-
 Zambia
-
 Zimbabwe
- Forex
- Crypto












