

Sei declines as sellers dominate and rebound potential is limited

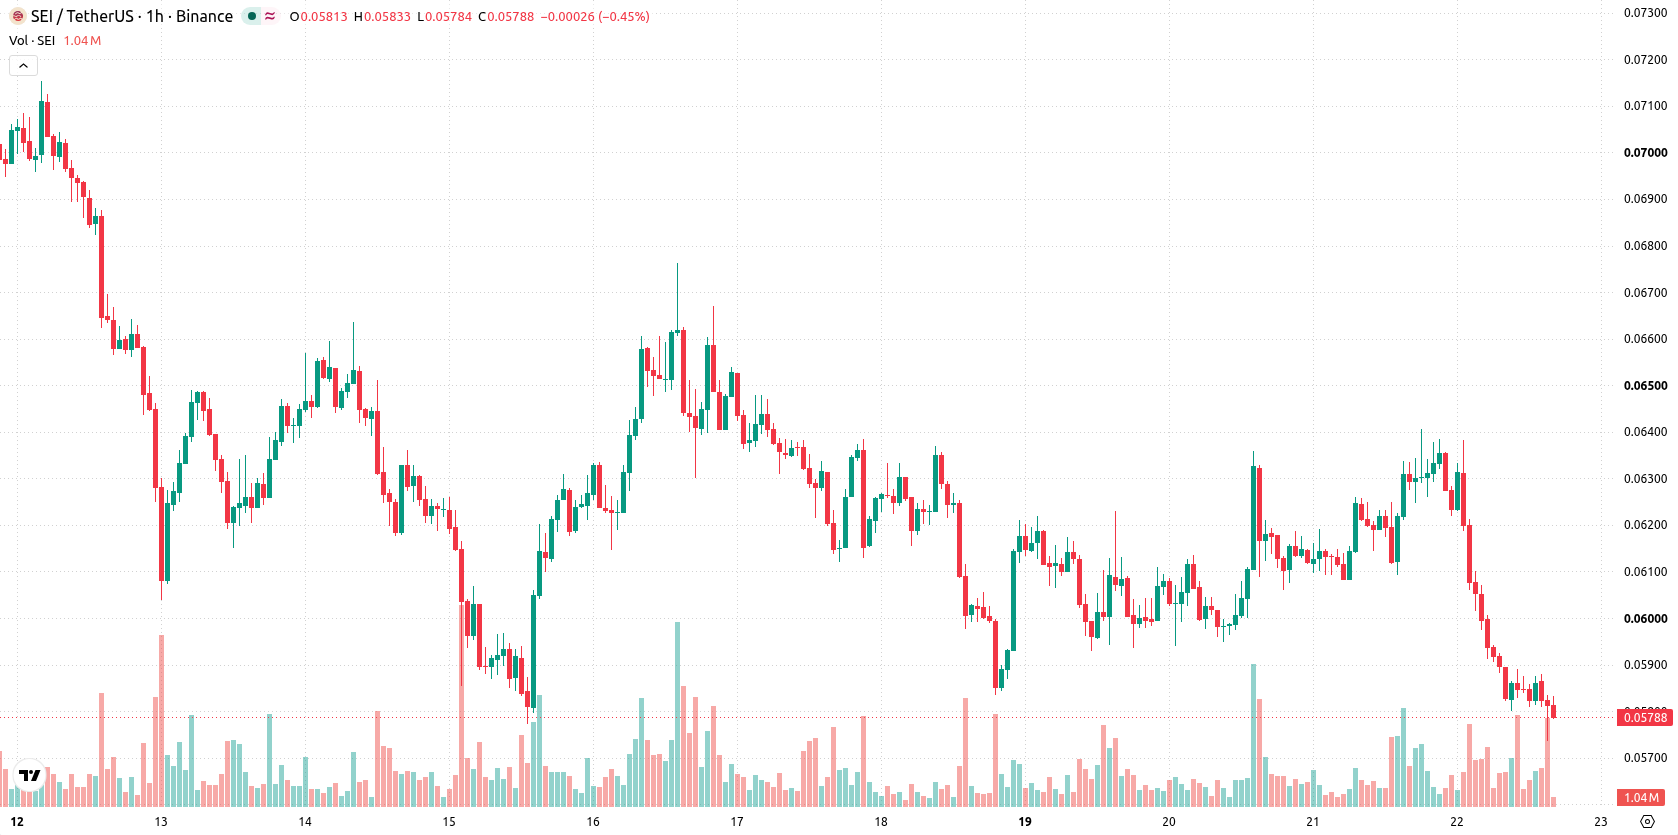
Sei (SEI) is trading at $0.058, marking a daily decline of 7.72%. The asset is currently positioned below its near-term and intermediate moving averages, indicating prevailing downward pressure in the short run.
 0.0486
0.0545
Highlights
- Sei recorded 2,510 real-world asset holder addresses and $291,039,018 in tokenized real-world asset value on its platform, excluding stablecoins.
- Tokenized asset holder addresses grew 24% and transfer volume surged 206%, indicating expanding participation and transaction activity on Sei.
- SEI/USD trades below key moving averages with strong seller control, a deeply oversold signal, and an expected range of $0.0559 to $0.0628.
Network participation rises amid price pressure and tokenization growth
Sei continues to see network adoption, with Tokenpost reporting on October 21 that 2,510 real-world asset holder addresses and $291,039,018 in tokenized real-world asset value were recorded on the platform, excluding stablecoins. This substantial level of asset tokenization highlights active participation and integration of real-world assets into the Sei ecosystem. Additionally, a reported 24% growth in tokenized asset holder addresses alongside a 206% surge in transfer volume illustrates broadening transactional activity and further network utilization, though price action has remained under broader selling pressure.
Oversold momentum persists as technical barriers cap rebounds
SEI/USD trades below the MA-20 ($0.0601) and MA-50 ($0.0612) on the hourly chart, while staying above the MA-200 ($0.0544) on the daily. The Ichimoku Kijun currently acts as resistance at $0.0608. Technical momentum remains negative, as Sell signals are confirmed by both MACD and ADX. The RSI is deeply oversold at 27.457, and this is reinforced by Stoch RSI and CCI, which also point to limited rebound potential. Bull/Bear Power shows sellers dominating intraday moves, while the Awesome Oscillator is neutral and not confirming any reversal or continuation signals.
Downside risks dominate as consolidation narrows short-term range
In the short term, SEI/USD is likely to consolidate within the $0.0559–$0.0628 volatility band relative to current levels. The probability of further downside is high, with only a weak prospect for upward movement unless a break above $0.0608 resistance occurs. The base scenario anticipates range-bound action, but a sustained move below $0.0559 support would likely open the way for additional losses.
Earlier, analysts noted that SEI was exhibiting sustained near-term bearish momentum despite new derivatives market access. The current analysis reinforces this outlook, with persistent technical weakness and the emergence of heavy network activity suggesting traders should closely monitor the $0.0608 resistance level for any early signs of a potential reversal.










-
 Afghanistan
-
 Albania
-
 Algeria
-
 Angola
-
 Argentina
-
 Armenia
-
 Australia
-
 Austria
-
 Azerbaijan
-
 Bahamas
-
 Bahrain
-
 Bangladesh
-
 Belarus
-
 Belgium
-
 Bolivia
-
 Botswana
-
 Brazil
-
 Brunei
-
 Bulgaria
-
 Cambodia
-
 Cameroon
-
 Canada
-
 Chile
-
 China
-
 Colombia
-
 Congo
-
 Costa Rica
-
 Cote d'Ivoire
-
 Croatia
-
 Cuba
-
 Cyprus
-
 Czechia
-
 DR Congo
-
 Denmark
-
 Dominican Republic
-
 Ecuador
-
 Egypt
-
 El Salvador
-
 Estonia
-
 Eswatini
-
 Ethiopia
-
 Finland
-
 France
-
 Georgia
-
 Germany
-
 Ghana
-
 Greece
-
 Haiti
-
 Hong Kong
-
 Hungary
-
 India
-
 Indonesia
-
 Iran, Islamic republic
-
 Iraq
-
 Ireland
-
 Israel
-
 Italy
-
 Jamaica
-
 Japan
-
 Jordan
-
 Kazakhstan
-
 Kenya
-
 Korea
-
 Kuwait
-
 Kyrgyzstan
-
 Laos
-
 Latvia
-
 Lebanon
-
 Lesotho
-
 Libya
-
 Lithuania
-
 Luxembourg
-
 Madagascar
-
 Malaysia
-
 Malta
-
 Mauritius
-
 Mexico
-
 Moldova
-
 Mongolia
-
 Montenegro
-
 Morocco
-
 Mozambique
-
 Myanmar
-
 Namibia
-
 Nepal
-
 Netherlands
-
 New Zealand
-
 Nigeria
-
 North Macedonia
-
 Norway
-
 Oman
-
 Pakistan
-
 Palestine
-
 Panama
-
 Papua New Guinea
-
 Paraguay
-
 Peru
-
 Philippines
-
 Poland
-
 Portugal
-
 Puerto Rico
-
 Qatar
-
 Reunion
-
 Romania
-
 Rwanda
-
 Saudi Arabia
-
 Serbia
-
 Singapore
-
 Slovakia
-
 Slovenia
-
 Somalia
-
 South Africa
-
 Spain
-
 Sri Lanka
-
 Sweden
-
 Switzerland
-
 Syria
-
 Taiwan
-
 Tajikistan
-
 Tanzania
-
 Thailand
-
 Trinidad and Tobago
-
 Tunisia
-
 Turkey
-
 UAE
-
 Uganda
-
 Ukraine
-
 United Kingdom
-
United States
-
 Uruguay
-
 Uzbekistan
-
 Venezuela
-
 Vietnam
-
 Yemen
-
 Zambia
-
 Zimbabwe
- Forex
- Crypto












