

Will Sei extend its decline amid strong seller pressure?

Sei (SEI) is trading at $0.0337, down 9.77% over the past 24 hours. The price remains below its key moving averages, indicating sustained pressure from sellers in line with the recent downward move.
 0.0353
0.0404
Highlights
- Tokenized real-world asset transfer volume on Sei Network grew 62.49% in the past 30 days, indicating increased blockchain settlement activity.
- The number of real-world asset holders rose 12.27% over the same period, while price action remains under broader selling pressure.
- SEI/USD trades below key moving averages with weak momentum; price expected to consolidate in a $0.0307 to $0.0351 range as downside risk dominates.
User participation rises as transaction flows outpace price recovery
Tokenized real-world asset transfer volume on Sei Network rose by 62.49% over the past 30 days, according to Cryptonews, signaling a marked increase in blockchain-based settlement and activity for the platform. This expansion reflects a growing use case for Sei’s infrastructure, boosting transactional throughput and demonstrating ongoing development in the network’s utility. The number of RWA holders also grew by 12.27% during the same period, suggesting a steady rise in user participation, though price action has remained under broader selling pressure.
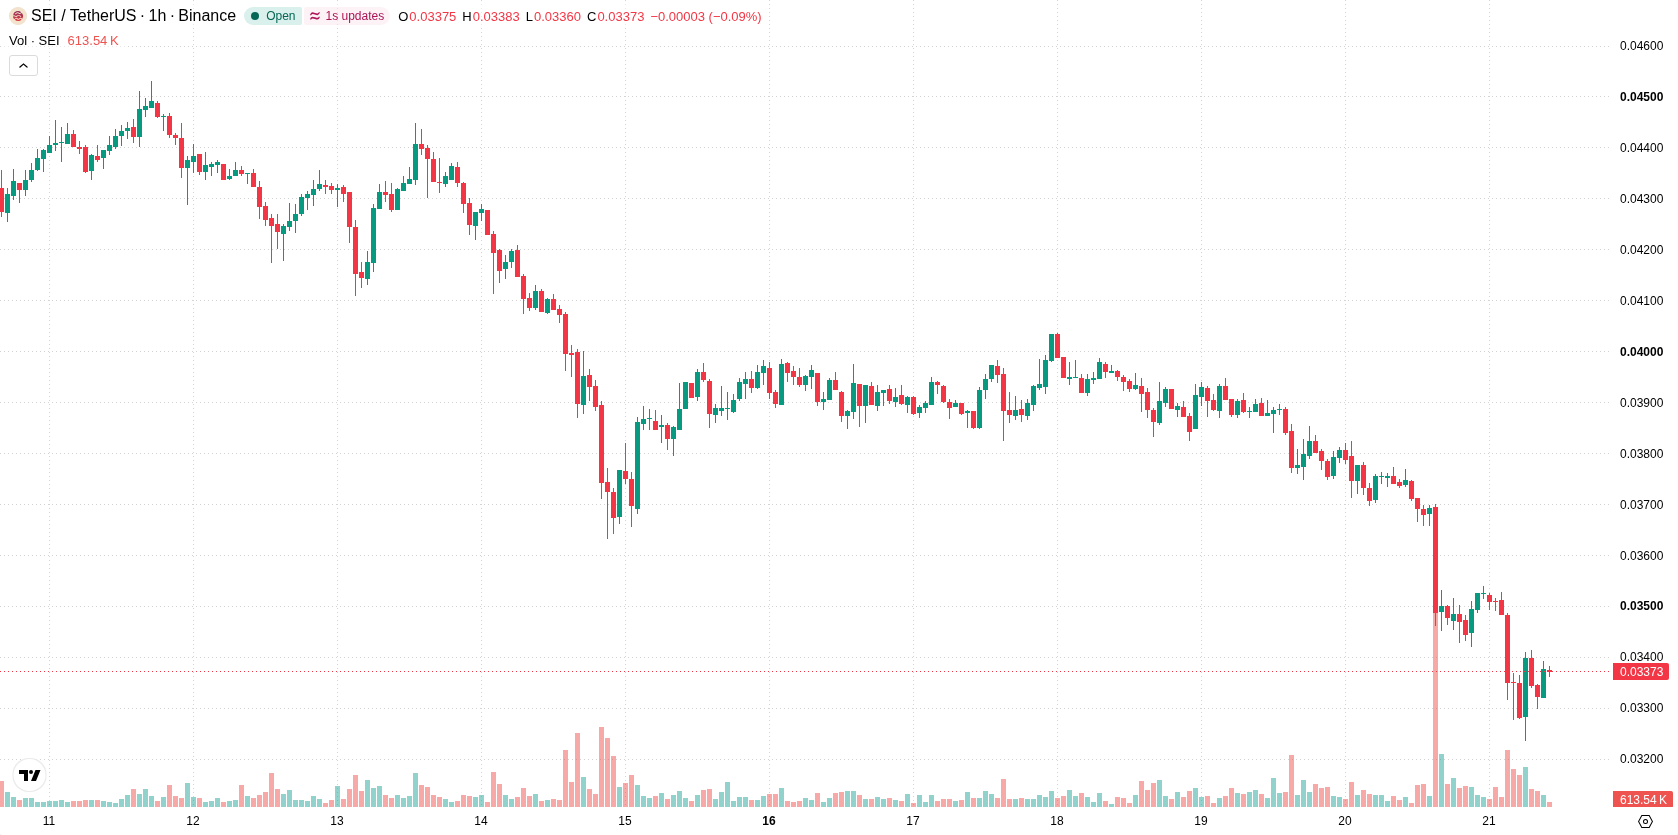
Seller dominance persists as mixed momentum clouds short-term outlook
SEI/USD is positioned below the H1 SMA-20 at $0.0345, H1 SMA-50 at $0.0365, and D1 SMA-200 at $0.0527. The Ichimoku Kijun on the hourly chart marks immediate resistance at $0.035. Among momentum indicators, MACD and ADX signal a sell bias. Oscillator readings are mixed: RSI is neutral, Stochastic RSI is in the overbought zone, and CCI is in the oversold zone. Bull/Bear Power registers at -0.0006, suggesting sellers are dominating today’s high-volatility session. Awesome Oscillator readings are neutral, and the conflicting extremes on Stochastic RSI and CCI call for added caution.
Further downside expected as rebound odds remain minimal
Over the next day, SEI/USD is forecast to trade between $0.0307 and $0.0351, with odds tilted strongly toward further downside and only a very low probability of a short-term rebound. The baseline scenario is consolidation within this range, with volatility centered around current levels. A move above $0.035 would clear immediate resistance and could trigger short covering, while a drop below $0.0307 would likely accelerate selling pressure and extend the decline.
Earlier, analysts noted that Sei faced persistent selling momentum and a predominantly bearish technical outlook, with downside risks dominating the forecast. The latest data on rising RWA activity adds a layer of fundamental growth but does not alter the prevailing scenario, making the $0.035 resistance an immediate level to watch for signs of any potential shift in trend.










-
 Afghanistan
-
 Albania
-
 Algeria
-
 Angola
-
 Argentina
-
 Armenia
-
 Australia
-
 Austria
-
 Azerbaijan
-
 Bahamas
-
 Bahrain
-
 Bangladesh
-
 Belarus
-
 Belgium
-
 Bolivia
-
 Botswana
-
 Brazil
-
 Brunei
-
 Bulgaria
-
 Cambodia
-
 Cameroon
-
 Canada
-
 Chile
-
 China
-
 Colombia
-
 Congo
-
 Costa Rica
-
 Cote d'Ivoire
-
 Croatia
-
 Cuba
-
 Cyprus
-
 Czechia
-
 DR Congo
-
 Denmark
-
 Dominican Republic
-
 Ecuador
-
 Egypt
-
 El Salvador
-
 Estonia
-
 Eswatini
-
 Ethiopia
-
 Finland
-
 France
-
 Georgia
-
 Germany
-
 Ghana
-
 Greece
-
 Haiti
-
 Hong Kong
-
 Hungary
-
 India
-
 Indonesia
-
 Iran, Islamic republic
-
 Iraq
-
 Ireland
-
 Israel
-
 Italy
-
 Jamaica
-
 Japan
-
 Jordan
-
 Kazakhstan
-
 Kenya
-
 Korea
-
 Kuwait
-
 Kyrgyzstan
-
 Laos
-
 Latvia
-
 Lebanon
-
 Lesotho
-
 Libya
-
 Lithuania
-
 Luxembourg
-
 Madagascar
-
 Malaysia
-
 Malta
-
 Mauritius
-
 Mexico
-
 Moldova
-
 Mongolia
-
 Montenegro
-
 Morocco
-
 Mozambique
-
 Myanmar
-
 Namibia
-
 Nepal
-
 Netherlands
-
 New Zealand
-
 Nigeria
-
 North Macedonia
-
 Norway
-
 Oman
-
 Pakistan
-
 Palestine
-
 Panama
-
 Papua New Guinea
-
 Paraguay
-
 Peru
-
 Philippines
-
 Poland
-
 Portugal
-
 Puerto Rico
-
 Qatar
-
 Reunion
-
 Romania
-
 Rwanda
-
 Saudi Arabia
-
 Serbia
-
 Singapore
-
 Slovakia
-
 Slovenia
-
 Somalia
-
 South Africa
-
 Spain
-
 Sri Lanka
-
 Sweden
-
 Switzerland
-
 Syria
-
 Taiwan
-
 Tajikistan
-
 Tanzania
-
 Thailand
-
 Trinidad and Tobago
-
 Tunisia
-
 Turkey
-
 UAE
-
 Uganda
-
 Ukraine
-
 United Kingdom
-
United States
-
 Uruguay
-
 Uzbekistan
-
 Venezuela
-
 Vietnam
-
 Yemen
-
 Zambia
-
 Zimbabwe
- Forex
- Crypto












