


Ethereum (ETH) fell 5.82% after heavy outflows from US spot Ethereum ETFs and large holders transferring significant volumes to exchanges drove intensified selling pressure. The move is reinforced by the pair trading below both short- and medium-term moving averages, with lingering downside momentum only partially tempered by longer-term structural support.
 1678.57
1866.89
Highlights
- US spot Ethereum ETFs posted about $170 million in outflows across three days, including $21.41 million on October 28, 2026.
- Large holders moved roughly 160,000 ETH worth $348 million to exchanges, and the Glamsterdam upgrade was postponed after a security issue.
- ETH/USD trades below key short- and medium-term moving averages with strong bearish momentum, expected to range from $2,148 to $2,306 over the next five sessions.
ETF outflows and large transfers accelerate decline amid Fed and upgrade setbacks
US spot Ethereum ETFs recorded approximately $170 million in outflows over a recent three-day period, including a $21.41 million single-day withdrawal on October 28, 2026. Large holders moved about 160,000 ETH, valued at $348 million, onto exchanges, highlighting increased selling activity. The decline was accompanied by a broader market retreat after the Federal Reserve maintained interest rates and by news of the Glamsterdam upgrade's postponement on the Hoodi testnet following a discovered security vulnerability.
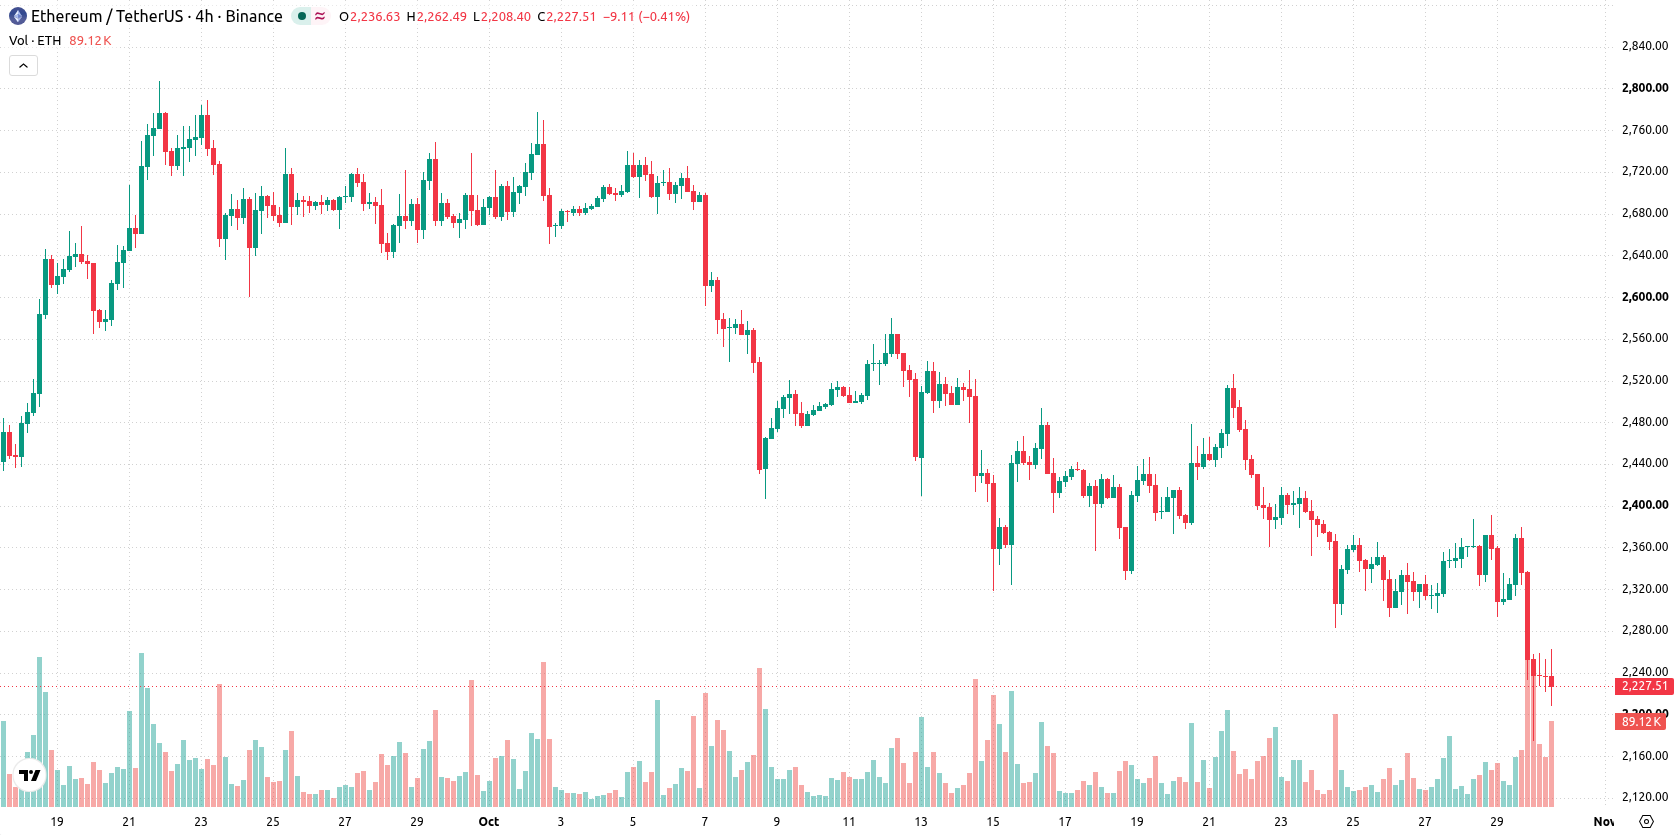
Persistent downward momentum as short-term pressure meets long-term support
ETH/USD is trading below the 20-day and 50-day moving averages ($2,412 and $2,532), but remains above the 200-day at $2,160. This setup suggests short- and medium-term selling pressure persists, tempered by longer-term structural support, with the nearest ceiling at $2,233 and floor at $2,174. Momentum readings are negative: the MACD is firmly bearish, and the ADX confirms strong downward pressure. The Relative Strength Index (RSI) and Stochastic RSI both point to oversold territory, echoed by the Commodity Channel Index (CCI) and Bull/Bear Power (BBP), which confirm sellers are dominating and short-term conditions are oversold. ETH/USD is trading at $2,227, down $137.65 or 5.82% on the day after a downside gap of $112.06 (about -4.74%). The pair is currently mid-range for the session, with intraday volatility at 3.91%. Price action reflects sustained downward pressure after the open, in line with the broader negative momentum signals.
Earlier, analysts noted that persistent institutional outflows and increased selling from large holders were driving a bearish outlook for Ethereum. The current data reinforce this view, with intensified outflows and exchange transfers heightening downside risks and making $2,148 a crucial level to watch in the sessions ahead.






Latest Ethereum News





-
 Afghanistan
-
 Albania
-
 Algeria
-
 Angola
-
 Argentina
-
 Armenia
-
 Australia
-
 Austria
-
 Azerbaijan
-
 Bahamas
-
 Bahrain
-
 Bangladesh
-
 Belarus
-
 Belgium
-
 Bolivia
-
 Botswana
-
 Brazil
-
 Brunei
-
 Bulgaria
-
 Cambodia
-
 Cameroon
-
 Canada
-
 Chile
-
 China
-
 Colombia
-
 Congo
-
 Costa Rica
-
 Cote d'Ivoire
-
 Croatia
-
 Cuba
-
 Cyprus
-
 Czechia
-
 DR Congo
-
 Denmark
-
 Dominican Republic
-
 Ecuador
-
 Egypt
-
 El Salvador
-
 Estonia
-
 Eswatini
-
 Ethiopia
-
 Finland
-
 France
-
 Georgia
-
 Germany
-
 Ghana
-
 Greece
-
 Haiti
-
 Hong Kong
-
 Hungary
-
 India
-
 Indonesia
-
 Iran, Islamic republic
-
 Iraq
-
 Ireland
-
 Israel
-
 Italy
-
 Jamaica
-
 Japan
-
 Jordan
-
 Kazakhstan
-
 Kenya
-
 Korea
-
 Kuwait
-
 Kyrgyzstan
-
 Laos
-
 Latvia
-
 Lebanon
-
 Lesotho
-
 Libya
-
 Lithuania
-
 Luxembourg
-
 Madagascar
-
 Malaysia
-
 Malta
-
 Mauritius
-
 Mexico
-
 Moldova
-
 Mongolia
-
 Montenegro
-
 Morocco
-
 Mozambique
-
 Myanmar
-
 Namibia
-
 Nepal
-
 Netherlands
-
 New Zealand
-
 Nigeria
-
 North Macedonia
-
 Norway
-
 Oman
-
 Pakistan
-
 Palestine
-
 Panama
-
 Papua New Guinea
-
 Paraguay
-
 Peru
-
 Philippines
-
 Poland
-
 Portugal
-
 Puerto Rico
-
 Qatar
-
 Reunion
-
 Romania
-
 Rwanda
-
 Saudi Arabia
-
 Serbia
-
 Singapore
-
 Slovakia
-
 Slovenia
-
 Somalia
-
 South Africa
-
 Spain
-
 Sri Lanka
-
 Sweden
-
 Switzerland
-
 Syria
-
 Taiwan
-
 Tajikistan
-
 Tanzania
-
 Thailand
-
 Trinidad and Tobago
-
 Tunisia
-
 Turkey
-
 UAE
-
 Uganda
-
 Ukraine
-
 United Kingdom
-
United States
-
 Uruguay
-
 Uzbekistan
-
 Venezuela
-
 Vietnam
-
 Yemen
-
 Zambia
-
 Zimbabwe
- Forex
- Crypto












