

Aave fully reopens lending platforms: Can AAVE sustain its latest gains?

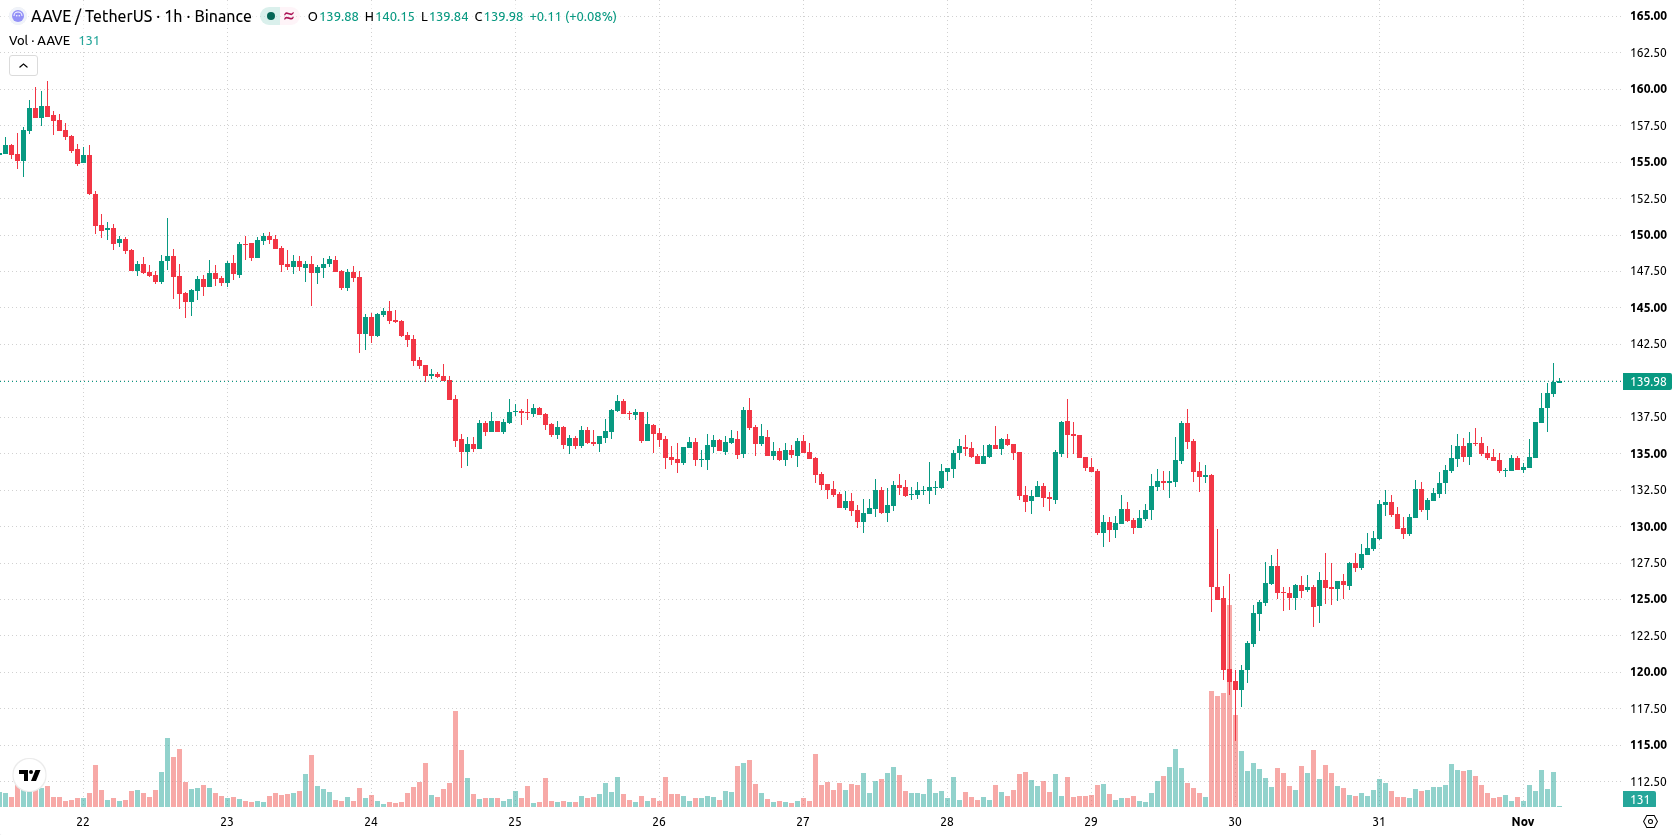
Aave (AAVE) is trading at $139.96, climbing 7.05% on the day and sitting firmly above its key moving averages. The token remains elevated versus its recent short- and medium-term averages, highlighting strong near-term momentum.
 98.46
114.51
Highlights
- Aave restored full access to all lending markets on its V3 and V4 platforms after temporarily freezing deposits and borrowing for security reasons.
- The protocol restricted new tBTC deposits and borrowing on Ethereum Core after tBTC minting was paused, without impacting existing user positions or contract integrity.
- AAVE/USD trades with strong bullish momentum and short-term support at $134.12, with price expected to range from $134.7 to $145.22 over the next 2 to 3 days.
Protocol liquidity rebounds as risk-driven market reopening follows security freeze
Aave has fully reopened all lending markets on its V3 and V4 platforms after having previously frozen deposits and borrowing as a precaution in response to a security incident linked to the Binance breach, according to Cryptotimes. This decisive action restored normal market access, increasing protocol liquidity and supporting renewed user participation. The protocol also limited new tBTC deposits and borrowing on its Ethereum Core market after Threshold Network temporarily paused tBTC minting for security maintenance, but all existing user positions and contract integrity remain unaffected, as reported by Panews. These developments underscore Aave's proactive risk management and rapid operational recovery during recent market disruptions.
Mixed technical signals as uptrend meets overbought pressure
Technically, AAVE/USD finds immediate support at the Ichimoku Kijun level of $134.12, while the MA-20 ($134.83) and MA-50 ($130.54) on the h1 chart provide additional layers beneath the current price. The daily MA-200 at $108.09 remains a deeper structural floor. Momentum signals are mixed: MACD and ADX register buy signals in line with the uptrend, yet overbought warnings are evident from CCI and Bull/Bear Power. Stochastic RSI paints a sharp divergence with a strong sell reading, highlighting oscillators' disagreement even as Awesome Oscillator confirms ongoing buyer control.
Sideways outlook dominates as upside hinges on resistance breakout
In the short term, prices are expected to move within a $134.7 to $145.22 volatility band relative to current levels. There is a 72% probability of continued upside momentum, while the chance of reversal stands at 28%. The base case sees AAVE/USD holding within a broad sideways range, but a bullish extension would depend on a sustained breakout above resistance. Conversely, a slip below the immediate support at $134.12 could risk triggering a deeper correction.
Previously it was reported that Aave's technical setup shifted positively after the protocol fully restored key functionalities following a security-related market freeze. The latest analysis reinforces this outlook, with ongoing price strength and a newly defined trading band suggesting traders should monitor the $134.12 level as pivotal for short-term trend direction.











-
 Afghanistan
-
 Albania
-
 Algeria
-
 Angola
-
 Argentina
-
 Armenia
-
 Australia
-
 Austria
-
 Azerbaijan
-
 Bahamas
-
 Bahrain
-
 Bangladesh
-
 Belarus
-
 Belgium
-
 Bolivia
-
 Botswana
-
 Brazil
-
 Brunei
-
 Bulgaria
-
 Cambodia
-
 Cameroon
-
 Canada
-
 Chile
-
 China
-
 Colombia
-
 Congo
-
 Costa Rica
-
 Cote d'Ivoire
-
 Croatia
-
 Cuba
-
 Cyprus
-
 Czechia
-
 DR Congo
-
 Denmark
-
 Dominican Republic
-
 Ecuador
-
 Egypt
-
 El Salvador
-
 Estonia
-
 Eswatini
-
 Ethiopia
-
 Finland
-
 France
-
 Georgia
-
 Germany
-
 Ghana
-
 Greece
-
 Haiti
-
 Hong Kong
-
 Hungary
-
 India
-
 Indonesia
-
 Iran, Islamic republic
-
 Iraq
-
 Ireland
-
 Israel
-
 Italy
-
 Jamaica
-
 Japan
-
 Jordan
-
 Kazakhstan
-
 Kenya
-
 Korea
-
 Kuwait
-
 Kyrgyzstan
-
 Laos
-
 Latvia
-
 Lebanon
-
 Lesotho
-
 Libya
-
 Lithuania
-
 Luxembourg
-
 Madagascar
-
 Malaysia
-
 Malta
-
 Mauritius
-
 Mexico
-
 Moldova
-
 Mongolia
-
 Montenegro
-
 Morocco
-
 Mozambique
-
 Myanmar
-
 Namibia
-
 Nepal
-
 Netherlands
-
 New Zealand
-
 Nigeria
-
 North Macedonia
-
 Norway
-
 Oman
-
 Pakistan
-
 Palestine
-
 Panama
-
 Papua New Guinea
-
 Paraguay
-
 Peru
-
 Philippines
-
 Poland
-
 Portugal
-
 Puerto Rico
-
 Qatar
-
 Reunion
-
 Romania
-
 Rwanda
-
 Saudi Arabia
-
 Serbia
-
 Singapore
-
 Slovakia
-
 Slovenia
-
 Somalia
-
 South Africa
-
 Spain
-
 Sri Lanka
-
 Sweden
-
 Switzerland
-
 Syria
-
 Taiwan
-
 Tajikistan
-
 Tanzania
-
 Thailand
-
 Trinidad and Tobago
-
 Tunisia
-
 Turkey
-
 UAE
-
 Uganda
-
 Ukraine
-
 United Kingdom
-
United States
-
 Uruguay
-
 Uzbekistan
-
 Venezuela
-
 Vietnam
-
 Yemen
-
 Zambia
-
 Zimbabwe
- Forex
- Crypto












