

Plasma slides lower as downward price move reflects strong selling pressure

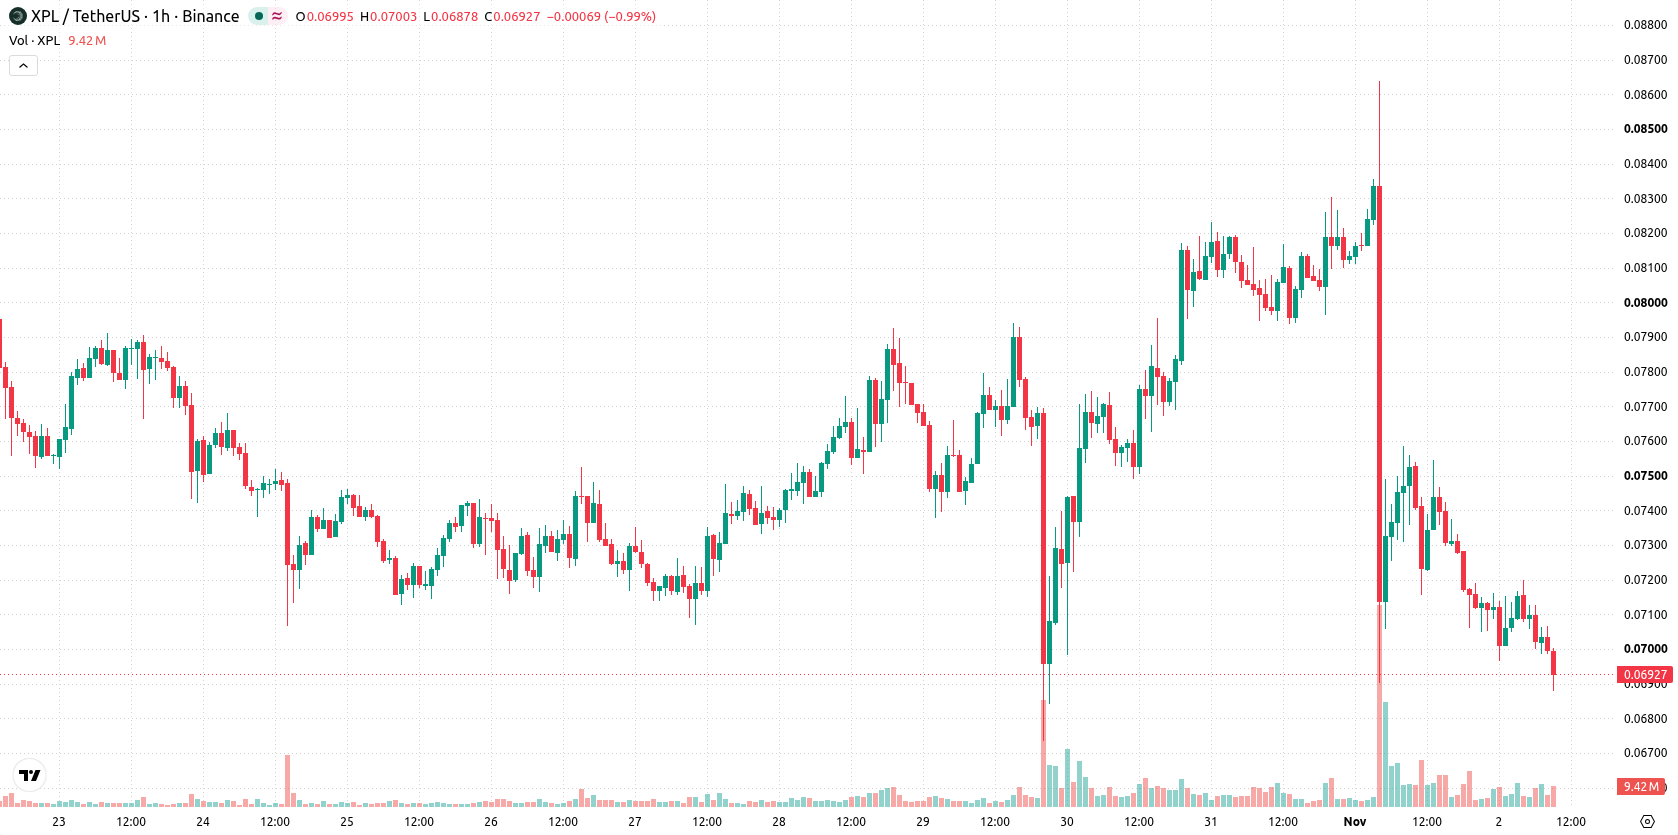
Plasma (XPL) is trading at $0.0693, down 7.29% for the day and marking a sharp drop from the previous session. The price currently sits below its key moving averages, and trading action has been concentrated near the session low with elevated volatility.
 0.0519
0.0673
Highlights
- Plasma (XPL) fell sharply on November 1, 2026, with a 7.29% daily loss and trading volume more than doubled its 30-day average.
- The surge in transaction volume during the price drop signals intensified selling pressure and increased risk aversion in the short term.
- XPL trades below major moving averages with most momentum signals negative, projecting a likely range of $0.065 to $0.0736 and a very high probability of further downside.
Selling momentum intensifies as volume spikes amid forced liquidation
On November 1, 2026, Plasma (XPL) experienced a sharp decline, with daily trading volume more than doubling the 30-day average, according to Diariobitcoin. Elevated transaction activity amid the selloff points to heightened supply-side pressure and a possible acceleration of forced selling, as participants reacted to rapid moves and market volatility. This surge in volume during a pronounced drop underscores the intensifying selling momentum and growing risk aversion in the immediate term.
Sustained bearish dominance as indicators and resistance levels align
On the technical front, XPL/USD is trading below the MA-20 and MA-50 on the hourly chart, as well as under the MA-200 on the daily timeframe, with the Ichimoku Kijun line situated at $0.0728 now representing immediate resistance. MACD signals a strong sell, while ADX confirms clear selling pressure. RSI continues to reflect selling territory, and both CCI and Bull/Bear Power indicate that sellers are dominating. Stoch RSI and Awesome Oscillator readings are currently neutral, showing limited evidence of a reversal at this stage.
Downside bias strengthens as breakout levels define risk scenarios
Looking ahead, the projected range for XPL/USD over the next two to three trading days is $0.065 to $0.0736. The probability of an upward move is assessed as very low, while continued downside appears highly likely. The base scenario is for sideways consolidation, but a decisive move above $0.0728 would open the door for a bullish turnaround, whereas a drop below $0.065 could accelerate losses within the current volatility band.
Earlier, analysts noted that Plasma was grappling with persistent downside risk and weak technical momentum following a surge in liquidations and volatility. The current session reinforces this bearish outlook, with intensified selling and elevated volume highlighting $0.065 as a critical level traders should monitor for potential acceleration of losses.










-
 Afghanistan
-
 Albania
-
 Algeria
-
 Angola
-
 Argentina
-
 Armenia
-
 Australia
-
 Austria
-
 Azerbaijan
-
 Bahamas
-
 Bahrain
-
 Bangladesh
-
 Belarus
-
 Belgium
-
 Bolivia
-
 Botswana
-
 Brazil
-
 Brunei
-
 Bulgaria
-
 Cambodia
-
 Cameroon
-
 Canada
-
 Chile
-
 China
-
 Colombia
-
 Congo
-
 Costa Rica
-
 Cote d'Ivoire
-
 Croatia
-
 Cuba
-
 Cyprus
-
 Czechia
-
 DR Congo
-
 Denmark
-
 Dominican Republic
-
 Ecuador
-
 Egypt
-
 El Salvador
-
 Estonia
-
 Eswatini
-
 Ethiopia
-
 Finland
-
 France
-
 Georgia
-
 Germany
-
 Ghana
-
 Greece
-
 Haiti
-
 Hong Kong
-
 Hungary
-
 India
-
 Indonesia
-
 Iran, Islamic republic
-
 Iraq
-
 Ireland
-
 Israel
-
 Italy
-
 Jamaica
-
 Japan
-
 Jordan
-
 Kazakhstan
-
 Kenya
-
 Korea
-
 Kuwait
-
 Kyrgyzstan
-
 Laos
-
 Latvia
-
 Lebanon
-
 Lesotho
-
 Libya
-
 Lithuania
-
 Luxembourg
-
 Madagascar
-
 Malaysia
-
 Malta
-
 Mauritius
-
 Mexico
-
 Moldova
-
 Mongolia
-
 Montenegro
-
 Morocco
-
 Mozambique
-
 Myanmar
-
 Namibia
-
 Nepal
-
 Netherlands
-
 New Zealand
-
 Nigeria
-
 North Macedonia
-
 Norway
-
 Oman
-
 Pakistan
-
 Palestine
-
 Panama
-
 Papua New Guinea
-
 Paraguay
-
 Peru
-
 Philippines
-
 Poland
-
 Portugal
-
 Puerto Rico
-
 Qatar
-
 Reunion
-
 Romania
-
 Rwanda
-
 Saudi Arabia
-
 Serbia
-
 Singapore
-
 Slovakia
-
 Slovenia
-
 Somalia
-
 South Africa
-
 Spain
-
 Sri Lanka
-
 Sweden
-
 Switzerland
-
 Syria
-
 Taiwan
-
 Tajikistan
-
 Tanzania
-
 Thailand
-
 Trinidad and Tobago
-
 Tunisia
-
 Turkey
-
 UAE
-
 Uganda
-
 Ukraine
-
 United Kingdom
-
United States
-
 Uruguay
-
 Uzbekistan
-
 Venezuela
-
 Vietnam
-
 Yemen
-
 Zambia
-
 Zimbabwe
- Forex
- Crypto












