
Uniswap price breaks down as selling pressure accelerates below $10

Uniswap (UNI) has broken down sharply from its ascending channel, confirming a short-term trend reversal after repeated failures near $10.95. The breakdown on July 30 followed a bearish pennant-like formation, sending UNI to an intraday low of $9.90.
Highlights
- Uniswap breaks below $10 after bearish pennant confirms trend shift
- Price trades below all major EMAs, with RSI at 35.68 showing weak momentum
- Net outflows exceed $6.6 million over two sessions, confirming ongoing distribution
Price now trades well below the key exponential moving averages, with the 20, 50, 100, and 200 EMAs all sloping downward, a structure that confirms continued weakness in the short-term trend. The steep rejection from the $10.95 zone triggered a rapid breakdown, invalidating the prior uptrend channel.
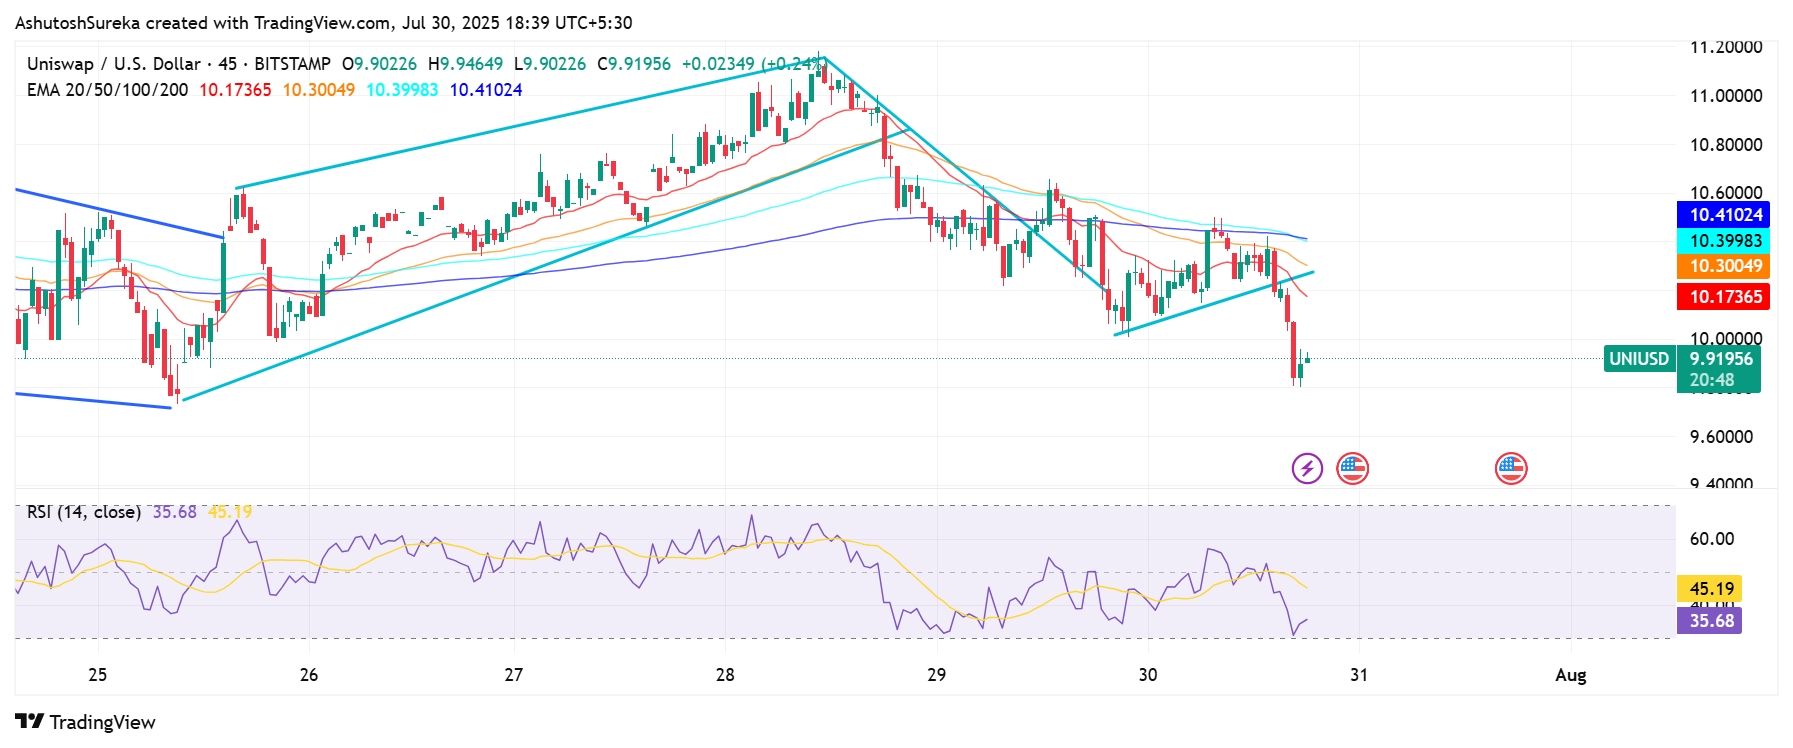
Uniswap price dynamics (Source: TradingView)
UNI has since attempted a minor rebound from $9.90, but the bounce has lacked strength, and the price remains far below the EMA cluster between $10.30 and $10.40. These moving averages now act as short-term resistance, and unless reclaimed, rallies are likely to face continued selling pressure.
The RSI at 35.68 hovers just above oversold territory. While this suggests the potential for short-term relief, the absence of any divergence or momentum reversal means sellers still dominate. Price remains vulnerable to additional downside unless momentum improves meaningfully in upcoming sessions.
On-chain outflows confirm distribution trend
Spot netflow data shows sustained selling activity. On July 30, net outflows spiked to $4.91 million, following $1.71 million the previous day. This wave of tokens leaving exchanges reflects an extended phase of distribution by holders, particularly after price failed to sustain above the $10.50 to $10.90 resistance zone. The on-chain data matches the breakdown on the price chart, adding conviction to the bearish setup.
What to watch going forward
To neutralize the current trend, UNI must reclaim the $10.30 to $10.40 range and flip EMAs into support. Until then, any rebound attempt may stall near $10.20 or lower, offering sellers fresh entry points. Key downside levels to monitor are $9.60 and $9.20, both of which could be tested if the selling pressure continues.
As discussed in previous updates, UNI’s failure to hold above key resistances and the shift in netflow behavior signal a weakening trend. For any recovery to hold, traders should watch for RSI to push above 45 and for on-chain outflows to ease. Until those signals emerge, caution remains warranted.


Latest Uniswap (UNI) News


-
 Afghanistan
-
 Albania
-
 Algeria
-
 Angola
-
 Argentina
-
 Armenia
-
 Australia
-
 Austria
-
 Azerbaijan
-
 Bahamas
-
 Bahrain
-
 Bangladesh
-
 Belarus
-
 Belgium
-
 Bolivia
-
 Botswana
-
 Brazil
-
 Brunei
-
 Bulgaria
-
 Cambodia
-
 Cameroon
-
 Canada
-
 Chile
Chile
-
 China
China
-
 Colombia
-
 Congo
Congo
-
 Costa Rica
-
 Cote d'Ivoire
-
 Croatia
-
 Cuba
Cuba
-
 Cyprus
-
 Czechia
-
 DR Congo
-
 Denmark
-
 Dominican Republic
-
 Ecuador
-
 Egypt
Egypt
-
 El Salvador
-
 Estonia
-
 Eswatini
-
 Ethiopia
-
 Finland
-
 France
-
 Georgia
-
 Germany
-
 Ghana
Ghana
-
 Greece
-
 Haiti
Haiti
-
 Hong Kong
-
 Hungary
-
 India
India
-
 Indonesia
-
 Iran, Islamic republic
-
 Iraq
Iraq
-
 Ireland
-
 Israel
-
 Italy
Italy
-
 Jamaica
-
 Japan
Japan
-
 Jordan
-
 Kazakhstan
-
 Kenya
Kenya
-
 Korea
Korea
-
 Kuwait
-
 Kyrgyzstan
-
 Laos
Laos
-
 Latvia
-
 Lebanon
-
 Lesotho
-
 Libya
Libya
-
 Lithuania
-
 Luxembourg
-
 Madagascar
-
 Malaysia
-
 Malta
Malta
-
 Mauritius
-
 Mexico
-
 Moldova
-
 Mongolia
-
 Montenegro
-
 Morocco
-
 Mozambique
-
 Myanmar
-
 Namibia
-
 Nepal
Nepal
-
 Netherlands
-
 New Zealand
-
 Nigeria
-
 North Macedonia
-
 Norway
-
 Oman
Oman
-
 Pakistan
-
 Palestine
-
 Panama
-
 Papua New Guinea
-
 Paraguay
-
 Peru
Peru
-
 Philippines
-
 Poland
-
 Portugal
-
 Puerto Rico
-
 Qatar
Qatar
-
 Reunion
-
 Romania
-
 Rwanda
-
 Saudi Arabia
-
 Serbia
-
 Singapore
-
 Slovakia
-
 Slovenia
-
 Somalia
-
 South Africa
-
 Spain
Spain
-
 Sri Lanka
-
 Sweden
-
 Switzerland
-
 Syria
Syria
-
 Taiwan
-
 Tajikistan
-
 Tanzania
-
 Thailand
-
 Trinidad and Tobago
-
 Tunisia
-
 Turkey
-
 UAE
UAE
-
 Uganda
-
 Ukraine
-
 United Kingdom
-
United States
-
 Uruguay
-
 Uzbekistan
-
 Venezuela
-
 Vietnam
-
 Yemen
Yemen
-
 Zambia
-
 Zimbabwe
- Forex
- Crypto
