

BTC weekly outlook: Can Bitcoin recover after heavy U.S. ETF outflows hit sentiment?

Heavy outflows from U.S. spot Bitcoin ETFs have driven Bitcoin (BTC) near $78,400, with the asset dropping nearly 4% over the past week. The pullback reflects heightened investor caution in response to shifting ETF demand and lingering uncertainty following security and regulatory news, setting up a test for support heading into the week ahead.
 78718
81971.00
Highlights
- Bitcoin fell 3.86% over the last 7 days to $78,404, losing short-term momentum but holding above its 200-day average.
- Daily chart shows a move into the lower part of the weekly range with sell signals from MACD and ADX, and CCI entering oversold territory, creating potential for a rebound.
- Expected 7-day range is $75,416 to $81,391 with a 61% probability of further downside, and key support at $76,325.
ETF redemptions accelerate as election and security concerns hit sentiment
Spot Bitcoin ETFs in the U.S. saw the largest outflows since June, with $1.04 billion withdrawn on November 1 and 4, according to Quartz. Additional ETF outflows of $1.3 billion across Bitcoin and Ethereum were reported from October 30 to November 2 by 24/7 Wall St., reflecting investor reactions to election uncertainty and a Binance security breach. Meanwhile, Strategy Inc. confirmed it purchased 811 Bitcoin using proceeds from stock sales, according to Yahoo Finance.
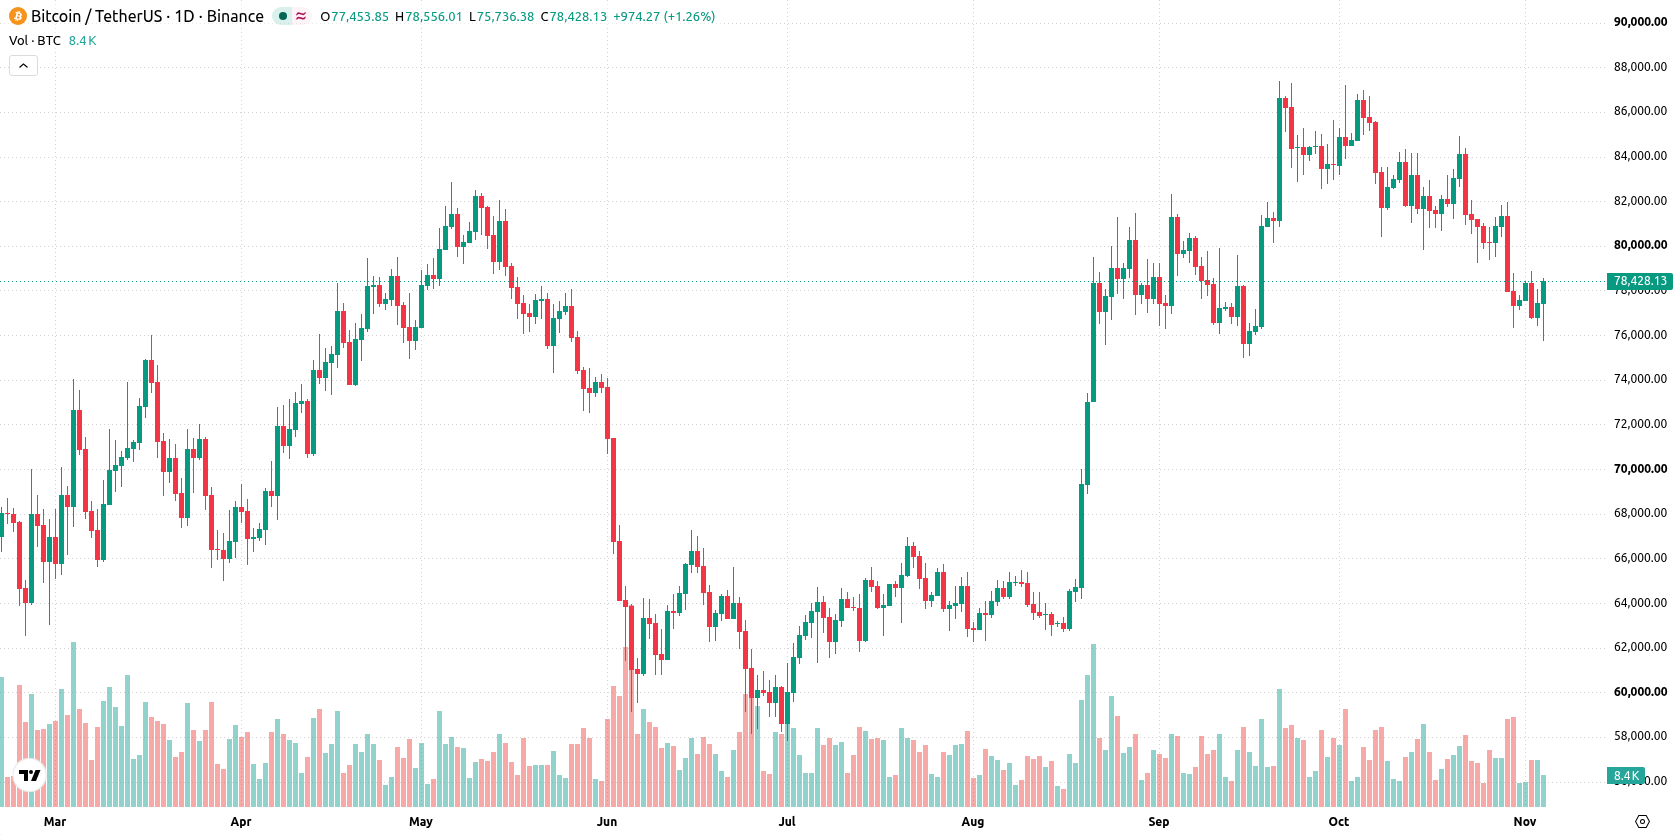
Momentum remains negative over the week as CCI signals potential rebound
The daily chart shows Bitcoin settling in the lower part of its weekly range, with momentum indicators diverging. MACD and ADX both continue to signal sell, while CCI enters an oversold zone at -130.37, introducing potential for a near-term rebound. With 7.4% volatility, price action is caught between support at $76,325 and resistance at the MA-20 and Ichimoku Kijun near $80,422–$80,611. This reflects an emerging move lower that is not yet confirmed, with daily momentum pointing to further downside risk but some signals hinting at possible exhaustion.
Choppy downside bias seen next week as sellers hold below resistance
For the next 7 days, the expected range is $75,416 to $81,391, with a 39% probability of an increase and 61% chance of a decrease. The base case anticipates further choppy action inside this band, as sellers hold the upper hand. A close above resistance at $80,422 could prompt a run to the top of the range near $81,391. Conversely, sustained weakness below $76,325 would open the door to further declines toward $75,416.
Earlier, analysts noted that ongoing political shifts and stalled regulatory reforms had left the U.S. cryptocurrency industry facing heightened uncertainty and the risk of further disruption. The current spike in ETF outflows and price volatility adds to this landscape, making the $76,325 support level a critical threshold to monitor for signs of renewed downside pressure in the coming week.










-
 Afghanistan
-
 Albania
-
 Algeria
-
 Angola
-
 Argentina
-
 Armenia
-
 Australia
-
 Austria
-
 Azerbaijan
-
 Bahamas
-
 Bahrain
-
 Bangladesh
-
 Belarus
-
 Belgium
-
 Bolivia
-
 Botswana
-
 Brazil
-
 Brunei
-
 Bulgaria
-
 Cambodia
-
 Cameroon
-
 Canada
-
 Chile
-
 China
-
 Colombia
-
 Congo
-
 Costa Rica
-
 Cote d'Ivoire
-
 Croatia
-
 Cuba
-
 Cyprus
-
 Czechia
-
 DR Congo
-
 Denmark
-
 Dominican Republic
-
 Ecuador
-
 Egypt
-
 El Salvador
-
 Estonia
-
 Eswatini
-
 Ethiopia
-
 Finland
-
 France
-
 Georgia
-
 Germany
-
 Ghana
-
 Greece
-
 Haiti
-
 Hong Kong
-
 Hungary
-
 India
-
 Indonesia
-
 Iran, Islamic republic
-
 Iraq
-
 Ireland
-
 Israel
-
 Italy
-
 Jamaica
-
 Japan
-
 Jordan
-
 Kazakhstan
-
 Kenya
-
 Korea
-
 Kuwait
-
 Kyrgyzstan
-
 Laos
-
 Latvia
-
 Lebanon
-
 Lesotho
-
 Libya
-
 Lithuania
-
 Luxembourg
-
 Madagascar
-
 Malaysia
-
 Malta
-
 Mauritius
-
 Mexico
-
 Moldova
-
 Mongolia
-
 Montenegro
-
 Morocco
-
 Mozambique
-
 Myanmar
-
 Namibia
-
 Nepal
-
 Netherlands
-
 New Zealand
-
 Nigeria
-
 North Macedonia
-
 Norway
-
 Oman
-
 Pakistan
-
 Palestine
-
 Panama
-
 Papua New Guinea
-
 Paraguay
-
 Peru
-
 Philippines
-
 Poland
-
 Portugal
-
 Puerto Rico
-
 Qatar
-
 Reunion
-
 Romania
-
 Rwanda
-
 Saudi Arabia
-
 Serbia
-
 Singapore
-
 Slovakia
-
 Slovenia
-
 Somalia
-
 South Africa
-
 Spain
-
 Sri Lanka
-
 Sweden
-
 Switzerland
-
 Syria
-
 Taiwan
-
 Tajikistan
-
 Tanzania
-
 Thailand
-
 Trinidad and Tobago
-
 Tunisia
-
 Turkey
-
 UAE
-
 Uganda
-
 Ukraine
-
 United Kingdom
-
United States
-
 Uruguay
-
 Uzbekistan
-
 Venezuela
-
 Vietnam
-
 Yemen
-
 Zambia
-
 Zimbabwe
- Forex
- Crypto












