


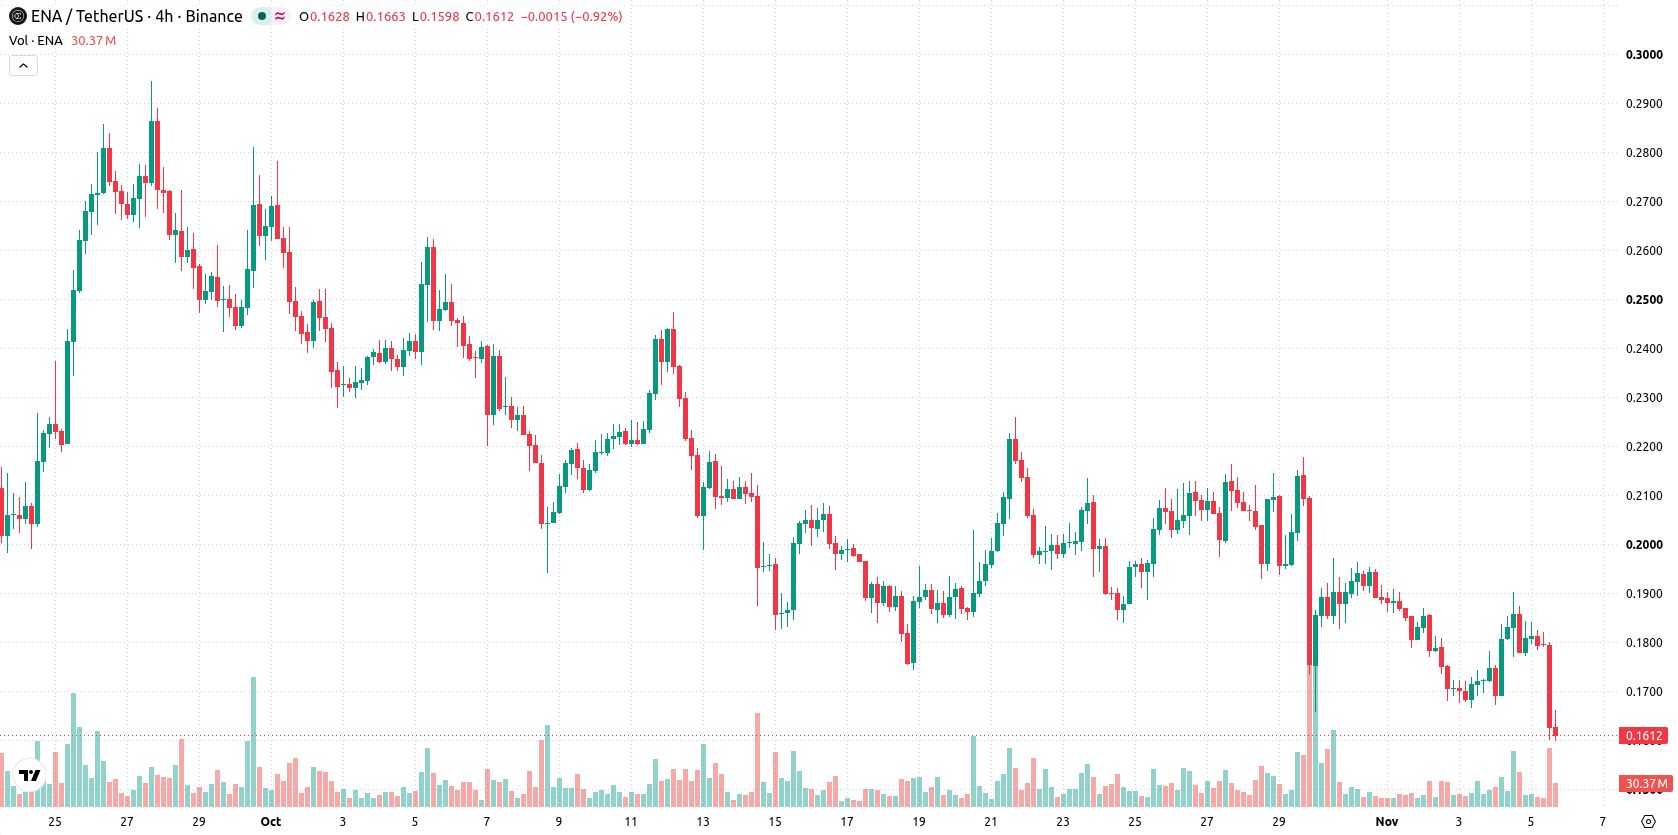
Ethena (ENA) dropped 11.98% after a series of large long liquidations and ongoing institutional adjustments weighed on sentiment. The decline is reinforced by the break below the 20- and 50-day moving averages, which signals sustained selling pressure.
 0.0998
0.1223
Highlights
- Ethena unveiled an institutional lending dashboard to increase transparency for loans and collateral oversight.
- ENA was approved as collateral for USD Coin loans via Kabu, and new daily reporting and asset restrictions were set for institutional lending.
- ENA/USD trades below key moving averages as technical signals show continued seller dominance, with an expected five-day range of $0.1346 to $0.1762.
Expanded lending oversight boosts utility amid persistent price weakness
Ethena introduced an institutional lending dashboard aimed at improving transparency for loans and collateral. The token was also added as eligible collateral for USD Coin loans via Kabu, and stricter guidelines were established for institutional lending, including daily reporting and specific asset restrictions. These actions expanded ENA’s utility and operational oversight, though price action has remained under broader selling pressure.
Short- and medium-term selling persists as mixed momentum signals emerge
ENA/USD has fallen below its 20-day and 50-day moving averages (MA-20 at $0.193 and MA-50 at $0.2112), indicating persistent short- and medium-term pressure from sellers. The price remains above the 200-day moving average (MA-200 at $0.1304), maintaining some long-term bullish structure. Immediate resistance is at $0.1657, with support at $0.1346. Momentum indicators show ongoing weakness: both MACD and ADX suggest continued selling. The RSI and Stochastic RSI are neutral, while CCI is oversold, hinting at possible exhaustion of sellers. Bull/Bear Power shows buyers narrowly dominating intraday momentum, but the overall tone is heavy after the open. The price has dropped to $0.1608 on 11.98% daily volatility, and trading remains near session lows, reflecting mixed momentum signals.
Earlier, analysts noted that Ethena's price structure exhibited bullish momentum, supported by expanded utility and operational reforms. The current breakdown below key moving averages marks a notable shift in technical posture, positioning $0.1346 as a decisive support level to watch for potential further downside.










-
 Afghanistan
-
 Albania
-
 Algeria
-
 Angola
-
 Argentina
-
 Armenia
-
 Australia
-
 Austria
-
 Azerbaijan
-
 Bahamas
-
 Bahrain
-
 Bangladesh
-
 Belarus
-
 Belgium
-
 Bolivia
-
 Botswana
-
 Brazil
-
 Brunei
-
 Bulgaria
-
 Cambodia
-
 Cameroon
-
 Canada
-
 Chile
-
 China
-
 Colombia
-
 Congo
-
 Costa Rica
-
 Cote d'Ivoire
-
 Croatia
-
 Cuba
-
 Cyprus
-
 Czechia
-
 DR Congo
-
 Denmark
-
 Dominican Republic
-
 Ecuador
-
 Egypt
-
 El Salvador
-
 Estonia
-
 Eswatini
-
 Ethiopia
-
 Finland
-
 France
-
 Georgia
-
 Germany
-
 Ghana
-
 Greece
-
 Haiti
-
 Hong Kong
-
 Hungary
-
 India
-
 Indonesia
-
 Iran, Islamic republic
-
 Iraq
-
 Ireland
-
 Israel
-
 Italy
-
 Jamaica
-
 Japan
-
 Jordan
-
 Kazakhstan
-
 Kenya
-
 Korea
-
 Kuwait
-
 Kyrgyzstan
-
 Laos
-
 Latvia
-
 Lebanon
-
 Lesotho
-
 Libya
-
 Lithuania
-
 Luxembourg
-
 Madagascar
-
 Malaysia
-
 Malta
-
 Mauritius
-
 Mexico
-
 Moldova
-
 Mongolia
-
 Montenegro
-
 Morocco
-
 Mozambique
-
 Myanmar
-
 Namibia
-
 Nepal
-
 Netherlands
-
 New Zealand
-
 Nigeria
-
 North Macedonia
-
 Norway
-
 Oman
-
 Pakistan
-
 Palestine
-
 Panama
-
 Papua New Guinea
-
 Paraguay
-
 Peru
-
 Philippines
-
 Poland
-
 Portugal
-
 Puerto Rico
-
 Qatar
-
 Reunion
-
 Romania
-
 Rwanda
-
 Saudi Arabia
-
 Serbia
-
 Singapore
-
 Slovakia
-
 Slovenia
-
 Somalia
-
 South Africa
-
 Spain
-
 Sri Lanka
-
 Sweden
-
 Switzerland
-
 Syria
-
 Taiwan
-
 Tajikistan
-
 Tanzania
-
 Thailand
-
 Trinidad and Tobago
-
 Tunisia
-
 Turkey
-
 UAE
-
 Uganda
-
 Ukraine
-
 United Kingdom
-
United States
-
 Uruguay
-
 Uzbekistan
-
 Venezuela
-
 Vietnam
-
 Yemen
-
 Zambia
-
 Zimbabwe
- Forex
- Crypto












