

Shiba Inu weekly forecast: support comes into focus after a stretched decline

Shiba Inu (SHIB) is trading near $0.0000046 after slipping around 3% this week, with technicals suggesting the decline has grown stretched. Support levels are now coming into focus as traders gauge whether the selling pressure will ease or intensify in the days ahead.
 0.054
0.05398
Highlights
- Shiba Inu trades at $0.0000046, falling 3.16% over the past 7 days and underperforming key averages.
- Bearish trend remains intact with the crypto below significant technical levels, though oversold momentum signals may limit further losses short term.
- Expected range for next week is $0.00000413 to $0.00000482, with more than 80% probability of additional downside unless price sustains above $0.00000485.
Exchange net inflows and major hacks shape SHIB sentiment despite volatility
Shiba Inu saw a shift in exchange netflows, turning positive with about 153 billion tokens in net inflows after a historic outflow streak, according to U.Today. Binance restored SHIB withdrawals following an earlier suspension due to a security issue, although CryptoNews.net noted this had limited direct impact on the token’s momentum. Meanwhile, TechBullion reported a hacker liquidated 499.9 billion stolen SHIB without causing significant market disruption, and the number of SHIB holders rebounded toward 1.7 million despite recent volatility, as highlighted by Coin-Turk.com.
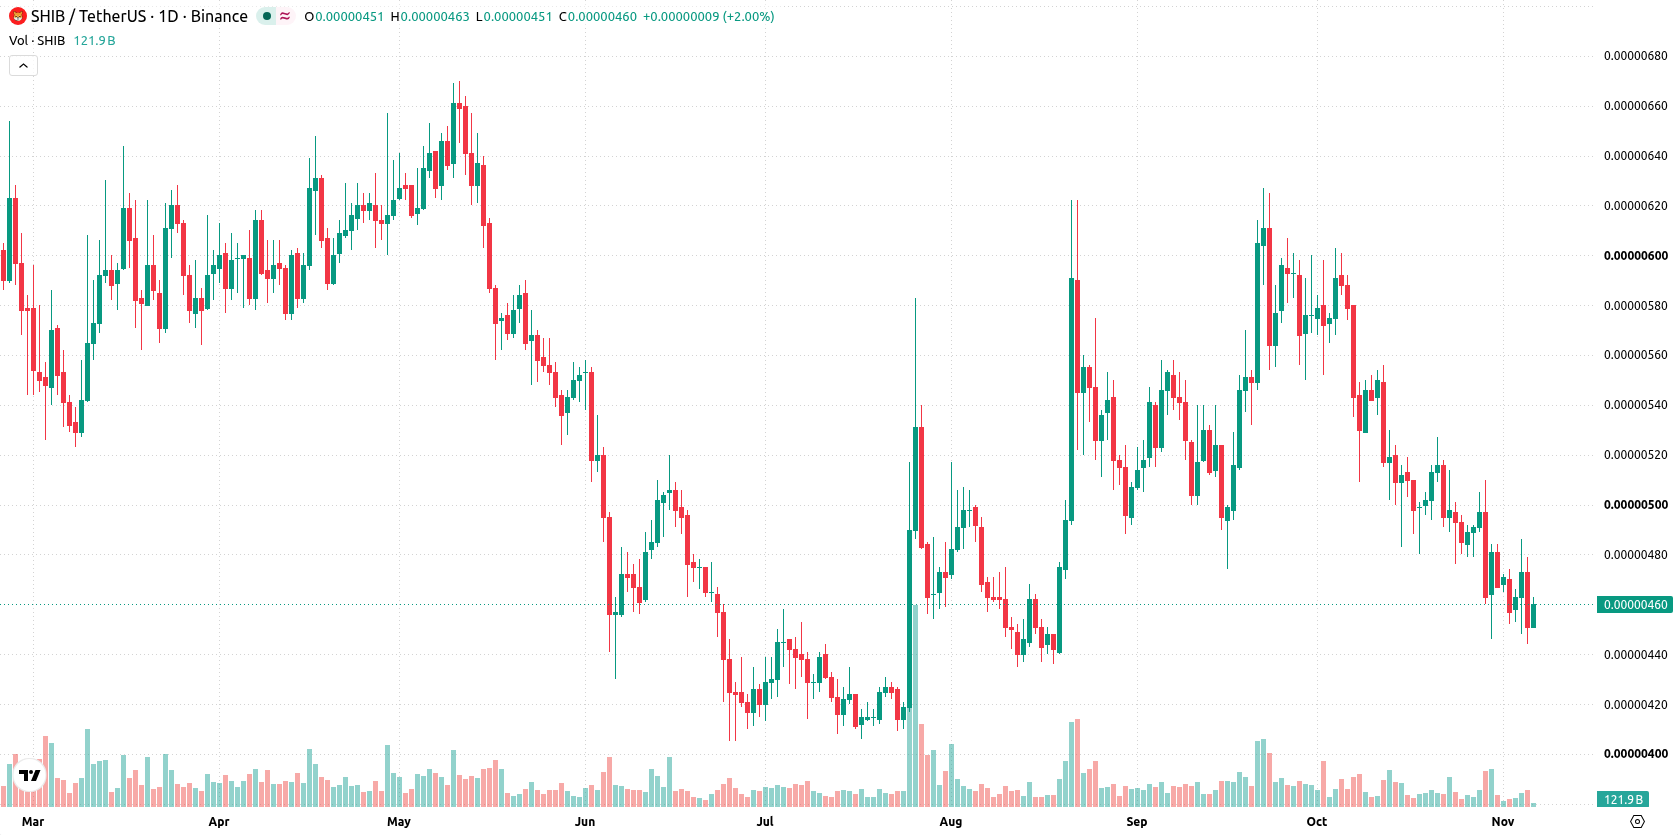
Oversold CCI reading sparks rebound hopes as downside momentum persists
On the daily chart, the trend is clearly pointed lower with a sustained move and volatility registering at 9.46%. MACD and ADX both signal further downside momentum, while CCI sits in its oversold zone at -118.7694704, suggesting possible selling exhaustion and some rebound potential in the near term. Nearest support is seen at $0.00000444 and resistance is just above at $0.00000485, with the Ichimoku Kijun at $0.000005 also acting as overhead resistance. This setup points to continued pressure, but the oversold CCI reading could temper the pace of decline.
Bearish bias prevails next week unless resistance is decisively broken
Next week, Shiba Inu is expected to move within a range of $0.00000413 to $0.00000482. There is a very low probability (less than 20%) of an increase and a very high probability (more than 80%) of a further decrease. Base case is continued weakness within the range. A sustained move above $0.00000485 would be the first sign of a bullish reversal, while a close below $0.00000444 opens the way for deeper losses.
Earlier, analysts noted that Shiba Inu faced persistent downside pressure as technicals confirmed a bearish bias despite regulatory and adoption milestones. The current analysis strengthens this view by highlighting the continued risk of further declines, with a close below $0.00000444 serving as a key level that could trigger deeper losses.






Latest SHIB News




-
 Afghanistan
-
 Albania
-
 Algeria
-
 Angola
-
 Argentina
-
 Armenia
-
 Australia
-
 Austria
-
 Azerbaijan
-
 Bahamas
-
 Bahrain
-
 Bangladesh
-
 Belarus
-
 Belgium
-
 Bolivia
-
 Botswana
-
 Brazil
-
 Brunei
-
 Bulgaria
-
 Cambodia
-
 Cameroon
-
 Canada
-
 Chile
-
 China
-
 Colombia
-
 Congo
-
 Costa Rica
-
 Cote d'Ivoire
-
 Croatia
-
 Cuba
-
 Cyprus
-
 Czechia
-
 DR Congo
-
 Denmark
-
 Dominican Republic
-
 Ecuador
-
 Egypt
-
 El Salvador
-
 Estonia
-
 Eswatini
-
 Ethiopia
-
 Finland
-
 France
-
 Georgia
-
 Germany
-
 Ghana
-
 Greece
-
 Haiti
-
 Hong Kong
-
 Hungary
-
 India
-
 Indonesia
-
 Iran, Islamic republic
-
 Iraq
-
 Ireland
-
 Israel
-
 Italy
-
 Jamaica
-
 Japan
-
 Jordan
-
 Kazakhstan
-
 Kenya
-
 Korea
-
 Kuwait
-
 Kyrgyzstan
-
 Laos
-
 Latvia
-
 Lebanon
-
 Lesotho
-
 Libya
-
 Lithuania
-
 Luxembourg
-
 Madagascar
-
 Malaysia
-
 Malta
-
 Mauritius
-
 Mexico
-
 Moldova
-
 Mongolia
-
 Montenegro
-
 Morocco
-
 Mozambique
-
 Myanmar
-
 Namibia
-
 Nepal
-
 Netherlands
-
 New Zealand
-
 Nigeria
-
 North Macedonia
-
 Norway
-
 Oman
-
 Pakistan
-
 Palestine
-
 Panama
-
 Papua New Guinea
-
 Paraguay
-
 Peru
-
 Philippines
-
 Poland
-
 Portugal
-
 Puerto Rico
-
 Qatar
-
 Reunion
-
 Romania
-
 Rwanda
-
 Saudi Arabia
-
 Serbia
-
 Singapore
-
 Slovakia
-
 Slovenia
-
 Somalia
-
 South Africa
-
 Spain
-
 Sri Lanka
-
 Sweden
-
 Switzerland
-
 Syria
-
 Taiwan
-
 Tajikistan
-
 Tanzania
-
 Thailand
-
 Trinidad and Tobago
-
 Tunisia
-
 Turkey
-
 UAE
-
 Uganda
-
 Ukraine
-
 United Kingdom
-
United States
-
 Uruguay
-
 Uzbekistan
-
 Venezuela
-
 Vietnam
-
 Yemen
-
 Zambia
-
 Zimbabwe
- Forex
- Crypto












