

SOL slides nearly 7% as price stays below key moving averages and liquidations surge

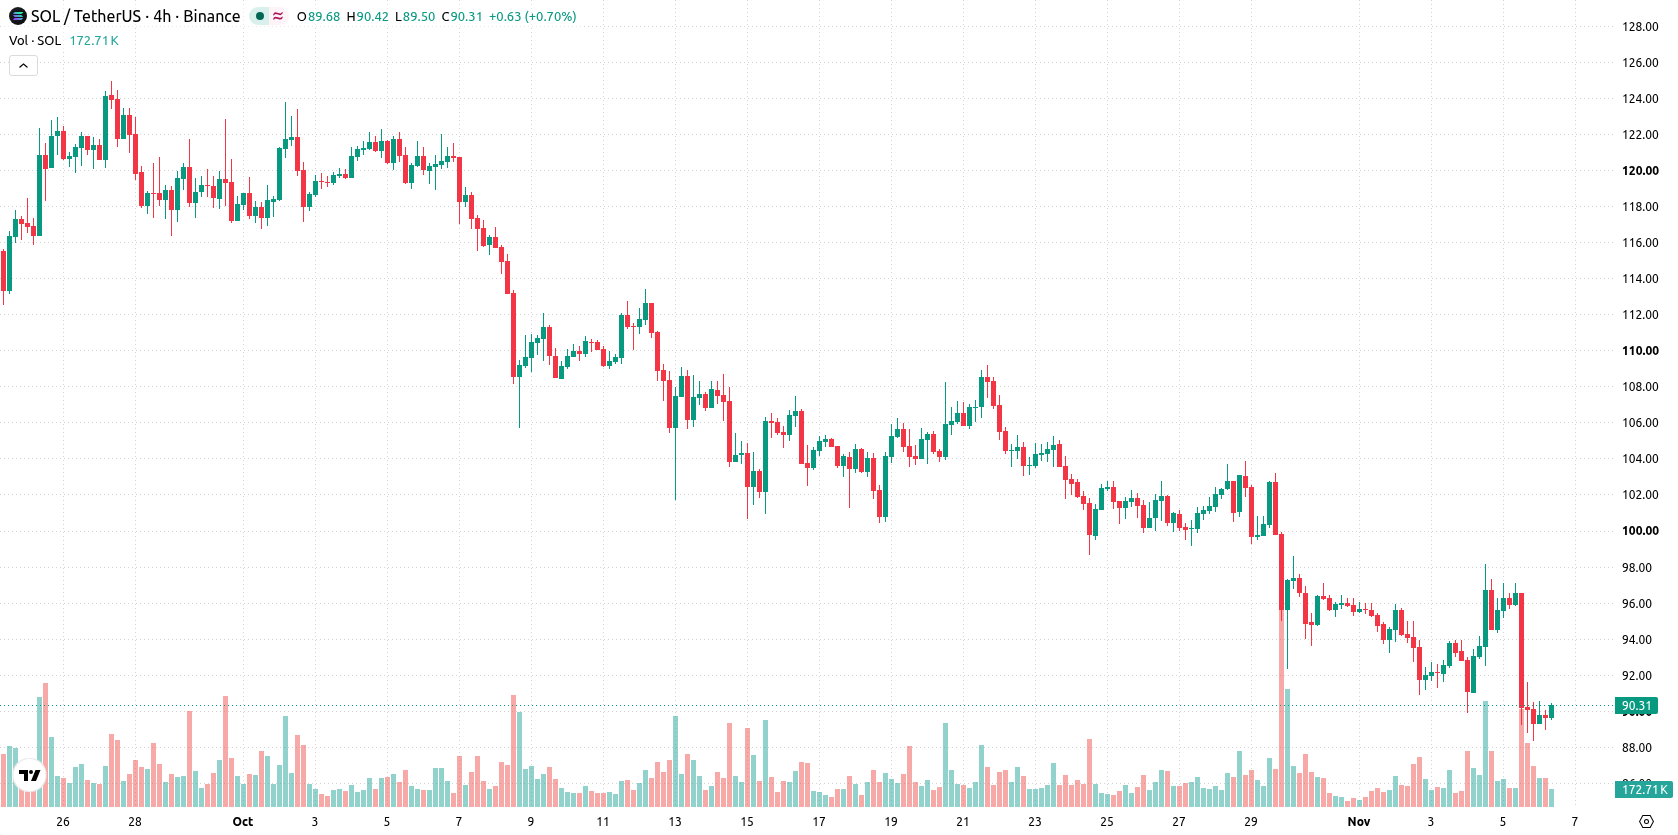
Solana (SOL) fell 6.8% after heavy liquidations across the crypto market, steep ETF outflows, and weaker futures open interest weighed on sentiment. Persistent selling pressure is reinforced by Solana trading below its 20-day and 50-day moving averages, with only the 200-day moving average offering long-term support.
 75.43
83.92
Highlights
- Solana fell below $90 and tested its 200-day moving average, pressured by liquidations, ETF outflows, and lower futures interest.
- China's central bank halted a Solana-linked event in Shanghai for regulatory violations, and Solana secured a USDC integration with Samsung Wallet in the US.
- Trading remains under sustained selling pressure, with downside signals and a very high probability of a move to the $83.36 to $95.09 range in the next five days.
Break below key levels as regulatory actions and upgrades collide
Solana recently dropped below $90 and tested its 200-day moving average for the first time since August after widespread liquidations, outflows from SOL-focused ETFs, and reduced open interest in Solana futures. China's central bank halted a Solana-related event in Shanghai, citing regulatory violations. The network also recorded a successful Alpenglow upgrade in October, improved performance metrics, surpassed $5 billion in tokenized assets, and was selected for USDC integration within Samsung Wallet in the United States, though price action has remained under broader selling pressure.
Technical support holds as negative momentum overshadows intraday buying
Solana is trading below its 20-day and 50-day moving averages at $99.69 and $108.49, indicating near-term and medium-term pressure from sellers. It remains above its 200-day moving average at $89.02, providing long-term technical support. The nearest resistance is at $90.57 with the floor anchored by the 200-day moving average, while the Ichimoku Kijun at $101.08 highlights continued overhead resistance. The long-term alignment of the MA-50 above the MA-200 signals a bullish trend. Momentum is negative, as both MACD and ADX point to downside risk. The RSI and CCI are in their oversold zones, while the Stochastic RSI reads neutral. Bull/Bear Power is positive at 0.55, suggesting some intraday buying attempts. Intraday price action shows pronounced weakness after the open and volatility at 1.83%.
Earlier, analysts noted that Solana was under pressure from operational risks and persistent selling, despite institutional interest and ongoing network upgrades. The current analysis reinforces the prevailing downside risk and highlights the 200-day moving average at $89.02 as the critical level to monitor for renewed losses toward $83.36.











-
 Afghanistan
-
 Albania
-
 Algeria
-
 Angola
-
 Argentina
-
 Armenia
-
 Australia
-
 Austria
-
 Azerbaijan
-
 Bahamas
-
 Bahrain
-
 Bangladesh
-
 Belarus
-
 Belgium
-
 Bolivia
-
 Botswana
-
 Brazil
-
 Brunei
-
 Bulgaria
-
 Cambodia
-
 Cameroon
-
 Canada
-
 Chile
-
 China
-
 Colombia
-
 Congo
-
 Costa Rica
-
 Cote d'Ivoire
-
 Croatia
-
 Cuba
-
 Cyprus
-
 Czechia
-
 DR Congo
-
 Denmark
-
 Dominican Republic
-
 Ecuador
-
 Egypt
-
 El Salvador
-
 Estonia
-
 Eswatini
-
 Ethiopia
-
 Finland
-
 France
-
 Georgia
-
 Germany
-
 Ghana
-
 Greece
-
 Haiti
-
 Hong Kong
-
 Hungary
-
 India
-
 Indonesia
-
 Iran, Islamic republic
-
 Iraq
-
 Ireland
-
 Israel
-
 Italy
-
 Jamaica
-
 Japan
-
 Jordan
-
 Kazakhstan
-
 Kenya
-
 Korea
-
 Kuwait
-
 Kyrgyzstan
-
 Laos
-
 Latvia
-
 Lebanon
-
 Lesotho
-
 Libya
-
 Lithuania
-
 Luxembourg
-
 Madagascar
-
 Malaysia
-
 Malta
-
 Mauritius
-
 Mexico
-
 Moldova
-
 Mongolia
-
 Montenegro
-
 Morocco
-
 Mozambique
-
 Myanmar
-
 Namibia
-
 Nepal
-
 Netherlands
-
 New Zealand
-
 Nigeria
-
 North Macedonia
-
 Norway
-
 Oman
-
 Pakistan
-
 Palestine
-
 Panama
-
 Papua New Guinea
-
 Paraguay
-
 Peru
-
 Philippines
-
 Poland
-
 Portugal
-
 Puerto Rico
-
 Qatar
-
 Reunion
-
 Romania
-
 Rwanda
-
 Saudi Arabia
-
 Serbia
-
 Singapore
-
 Slovakia
-
 Slovenia
-
 Somalia
-
 South Africa
-
 Spain
-
 Sri Lanka
-
 Sweden
-
 Switzerland
-
 Syria
-
 Taiwan
-
 Tajikistan
-
 Tanzania
-
 Thailand
-
 Trinidad and Tobago
-
 Tunisia
-
 Turkey
-
 UAE
-
 Uganda
-
 Ukraine
-
 United Kingdom
-
United States
-
 Uruguay
-
 Uzbekistan
-
 Venezuela
-
 Vietnam
-
 Yemen
-
 Zambia
-
 Zimbabwe
- Forex
- Crypto












