

Avalanche buyers struggle to regain control as institutional activity and integrations remain in focus: weekly outlook

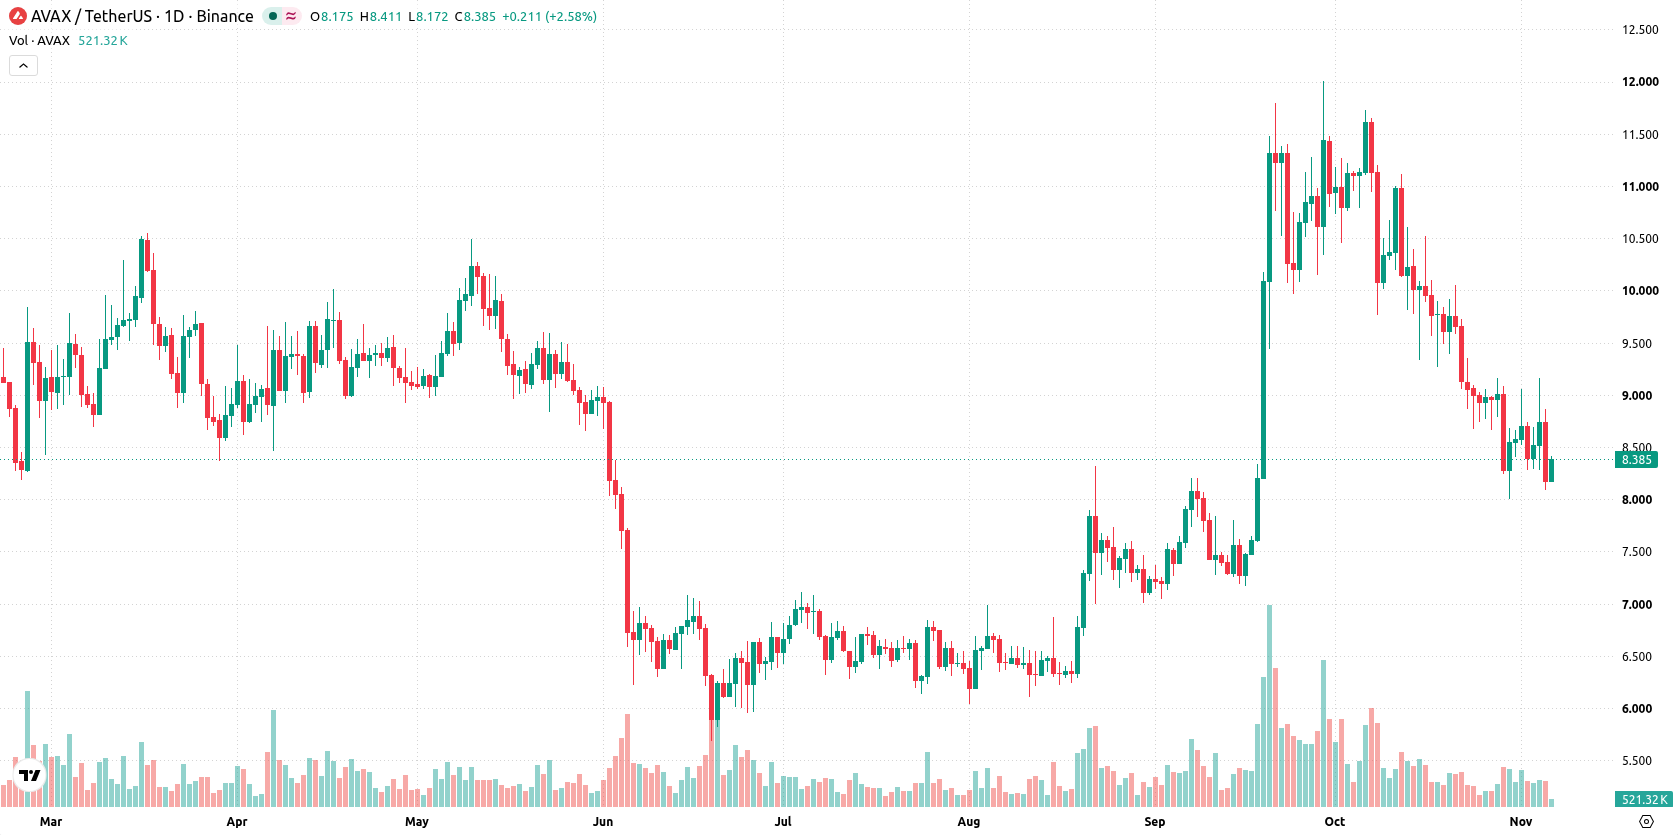
Avalanche (AVAX) is hovering near $8.40 as institutional interest shapes the conversation for the week ahead. Buyers remain on the defensive, with the asset consolidating as large-scale integrations continue to roll out across the ecosystem. This ongoing institutional engagement will be closely watched as market participants look for signs of renewed momentum.
 8.23
9.13
Highlights
- Avalanche trades at $8.39, showing minor losses over the week and remaining in the lower segment of its recent range.
- The setup indicates a weak short-term trend with mixed momentum signals and a decisively negative MACD.
- Price is projected to move between $7.6 and $8.94, with probable downside and resistance at $8.99 and $9.56.
Ecosystem expansion accelerates as new integrations and fee burns spur sentiment
Zengo, the eToro-owned MPC wallet, announced support for the Avalanche network and AVAX token on November 4, 2026, expanding global access and broadening reach for institutional and retail users, according to CryptoBriefing. Allbridge has also integrated the network, enabling new bridging options for AVAX and stablecoins as reported by X.com. Additionally, Japan's NEC is piloting stablecoin payments on the platform, and recent reports highlighted ongoing AVAX fee burns that may contribute to deflationary pressure.
Neutral momentum signals persist as MACD stays negative and volatility rises
On the daily chart, the setup shows a developing trend with a loss of momentum following a sharp move lower without a sustained direction. Neutral readings from RSI and CCI, both approaching but not reaching extreme territory, are met with a decisively negative MACD reading of -0.47. Volatility was 13% over the past seven days. With the nearest support at $8.14 (from the 200-day average) and resistance at $8.99 (from the 20-day average), the chart is currently tilted to the downside, while the Ichimoku Kijun at $9.56 serves as a higher resistance level.
Downside bias strengthens as range contracts and resistance remains unbroken
In the week ahead, Avalanche is expected to trade in a range between $7.6 and $8.94. There is a very low probability of an increase and a very high probability of a decrease. The base case is price action contained below the $8.99 resistance. A move above resistance could signal a challenge of the $9.56 Ichimoku Kijun, while breakdowns below $8.14 would expose the lower boundary of the projected range at $7.6.
Earlier, analysts noted that Avalanche was experiencing persistent bearish momentum as buyers struggled to defend long-term support. The current environment adds institutional integration as a potential catalyst, but with downside risk prevailing, traders should watch for any decisive move through the $8.99 resistance or a breakdown below $8.14 to gauge the next trend direction.






Latest Avalanche News




-
 Afghanistan
-
 Albania
-
 Algeria
-
 Angola
-
 Argentina
-
 Armenia
-
 Australia
-
 Austria
-
 Azerbaijan
-
 Bahamas
-
 Bahrain
-
 Bangladesh
-
 Belarus
-
 Belgium
-
 Bolivia
-
 Botswana
-
 Brazil
-
 Brunei
-
 Bulgaria
-
 Cambodia
-
 Cameroon
-
 Canada
-
 Chile
-
 China
-
 Colombia
-
 Congo
-
 Costa Rica
-
 Cote d'Ivoire
-
 Croatia
-
 Cuba
-
 Cyprus
-
 Czechia
-
 DR Congo
-
 Denmark
-
 Dominican Republic
-
 Ecuador
-
 Egypt
-
 El Salvador
-
 Estonia
-
 Eswatini
-
 Ethiopia
-
 Finland
-
 France
-
 Georgia
-
 Germany
-
 Ghana
-
 Greece
-
 Haiti
-
 Hong Kong
-
 Hungary
-
 India
-
 Indonesia
-
 Iran, Islamic republic
-
 Iraq
-
 Ireland
-
 Israel
-
 Italy
-
 Jamaica
-
 Japan
-
 Jordan
-
 Kazakhstan
-
 Kenya
-
 Korea
-
 Kuwait
-
 Kyrgyzstan
-
 Laos
-
 Latvia
-
 Lebanon
-
 Lesotho
-
 Libya
-
 Lithuania
-
 Luxembourg
-
 Madagascar
-
 Malaysia
-
 Malta
-
 Mauritius
-
 Mexico
-
 Moldova
-
 Mongolia
-
 Montenegro
-
 Morocco
-
 Mozambique
-
 Myanmar
-
 Namibia
-
 Nepal
-
 Netherlands
-
 New Zealand
-
 Nigeria
-
 North Macedonia
-
 Norway
-
 Oman
-
 Pakistan
-
 Palestine
-
 Panama
-
 Papua New Guinea
-
 Paraguay
-
 Peru
-
 Philippines
-
 Poland
-
 Portugal
-
 Puerto Rico
-
 Qatar
-
 Reunion
-
 Romania
-
 Rwanda
-
 Saudi Arabia
-
 Serbia
-
 Singapore
-
 Slovakia
-
 Slovenia
-
 Somalia
-
 South Africa
-
 Spain
-
 Sri Lanka
-
 Sweden
-
 Switzerland
-
 Syria
-
 Taiwan
-
 Tajikistan
-
 Tanzania
-
 Thailand
-
 Trinidad and Tobago
-
 Tunisia
-
 Turkey
-
 UAE
-
 Uganda
-
 Ukraine
-
 United Kingdom
-
United States
-
 Uruguay
-
 Uzbekistan
-
 Venezuela
-
 Vietnam
-
 Yemen
-
 Zambia
-
 Zimbabwe
- Forex
- Crypto












