


Renewed technical selling sparked a 15.24% drop in Saros (SAROS) amid persistent downside momentum and absence of fresh news. The move is supported by the asset's trading position below its key moving averages and ongoing signals of a prolonged bearish trend.
 0.0001
70
Highlights
- SAROS/USD remains below key moving averages, confirming persistent downward pressure across all timeframes.
- Trading is locked in an extremely tight range at $0.0001 to $0.0001, with zero intraday volatility.
- Technical indicators show mixed momentum signals, but probability favors a move lower over the next five days.
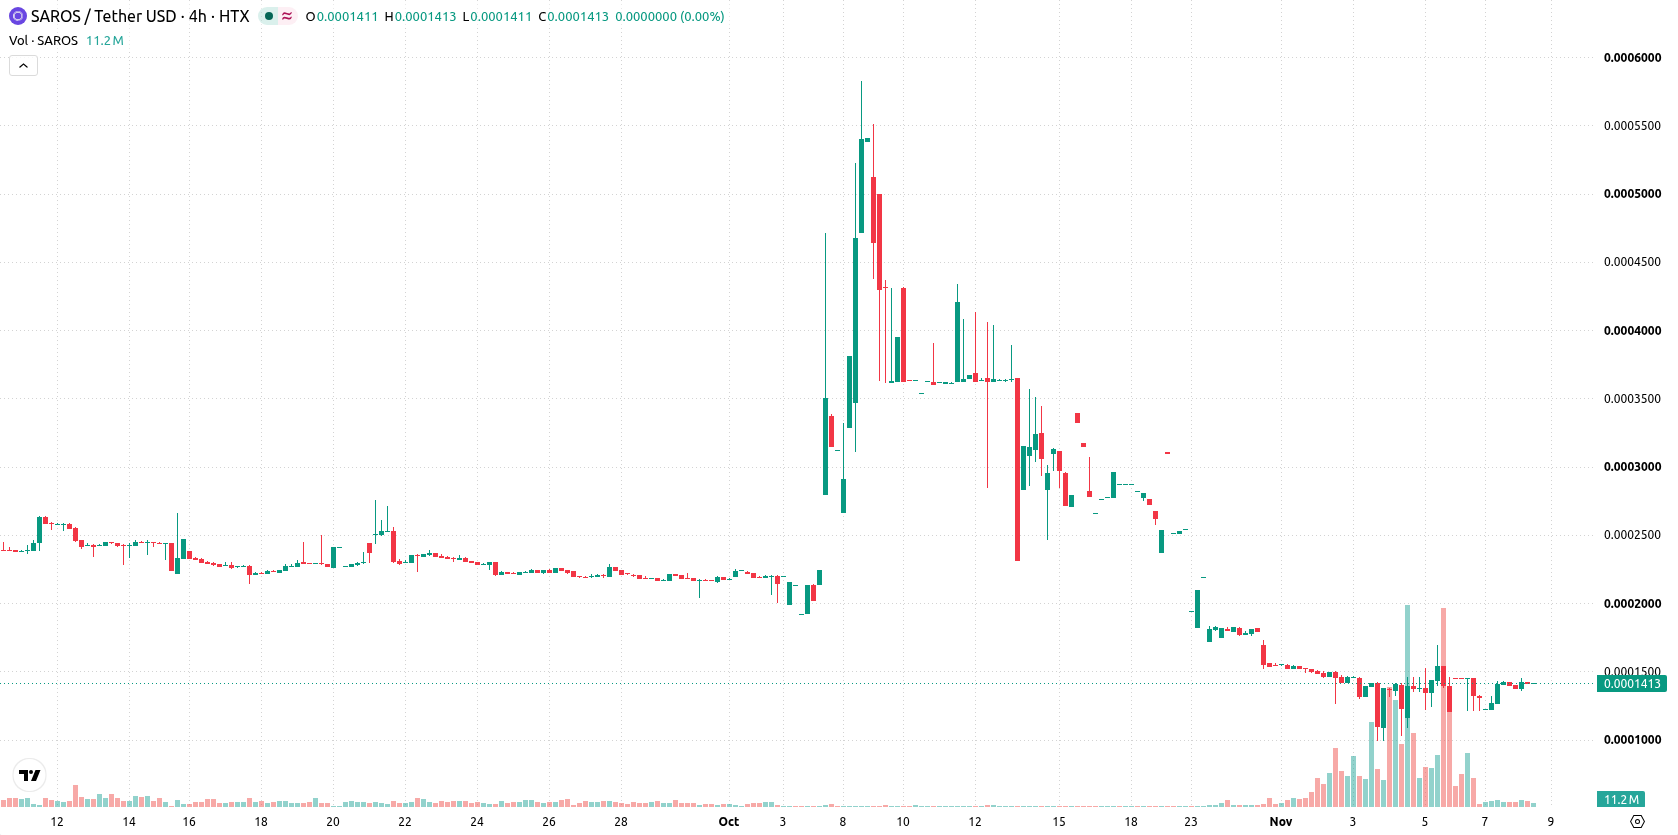
Bearish bias prevails as indicators conflict at narrow technical bounds
SAROS/USD is trading below the 20-day, 50-day, and 200-day moving averages ($0.0002, $0.0002, and $0.0004), signaling sustained downward pressure across short-, medium-, and long-term trends. Price is locked between a near-term ceiling and floor at $0.0001, indicating extremely tight range-bound action. The 50-day versus 200-day moving average alignment confirms a bearish long-term backdrop. Momentum readings show MACD and Commodity Channel Index (CCI) generate sell signals, while the Average Directional Index (ADX) points to moderate underlying trend strength. The Relative Strength Index (RSI) and CCI are both neutral, suggesting neither is approaching an extreme, but the Stochastic RSI is overbought. Bull/Bear Power (BBP) remains positive, indicating buyers have an edge in intraday activity. The asset opened nearly flat, the daily change is stable at 0 ($0.0001), with a loss of 15.24%. The pair traded entirely within a $0.0001–$0.0001 corridor, and intraday volatility stands at 0.00%. The market tone is one of stagnant, range-bound action with conflicting momentum signals.
Earlier, analysts noted that Saros was consolidating in a tight range with mixed technical signals and limited signs of sustained bullish momentum. The latest technical breakdown confirms the bearish bias, with a key risk now focused on whether Saros can hold above its near-term floor as sustained weakness could prompt further declines.










-
 Afghanistan
-
 Albania
-
 Algeria
-
 Angola
-
 Argentina
-
 Armenia
-
 Australia
-
 Austria
-
 Azerbaijan
-
 Bahamas
-
 Bahrain
-
 Bangladesh
-
 Belarus
-
 Belgium
-
 Bolivia
-
 Botswana
-
 Brazil
-
 Brunei
-
 Bulgaria
-
 Cambodia
-
 Cameroon
-
 Canada
-
 Chile
-
 China
-
 Colombia
-
 Congo
-
 Costa Rica
-
 Cote d'Ivoire
-
 Croatia
-
 Cuba
-
 Cyprus
-
 Czechia
-
 DR Congo
-
 Denmark
-
 Dominican Republic
-
 Ecuador
-
 Egypt
-
 El Salvador
-
 Estonia
-
 Eswatini
-
 Ethiopia
-
 Finland
-
 France
-
 Georgia
-
 Germany
-
 Ghana
-
 Greece
-
 Haiti
-
 Hong Kong
-
 Hungary
-
 India
-
 Indonesia
-
 Iran, Islamic republic
-
 Iraq
-
 Ireland
-
 Israel
-
 Italy
-
 Jamaica
-
 Japan
-
 Jordan
-
 Kazakhstan
-
 Kenya
-
 Korea
-
 Kuwait
-
 Kyrgyzstan
-
 Laos
-
 Latvia
-
 Lebanon
-
 Lesotho
-
 Libya
-
 Lithuania
-
 Luxembourg
-
 Madagascar
-
 Malaysia
-
 Malta
-
 Mauritius
-
 Mexico
-
 Moldova
-
 Mongolia
-
 Montenegro
-
 Morocco
-
 Mozambique
-
 Myanmar
-
 Namibia
-
 Nepal
-
 Netherlands
-
 New Zealand
-
 Nigeria
-
 North Macedonia
-
 Norway
-
 Oman
-
 Pakistan
-
 Palestine
-
 Panama
-
 Papua New Guinea
-
 Paraguay
-
 Peru
-
 Philippines
-
 Poland
-
 Portugal
-
 Puerto Rico
-
 Qatar
-
 Reunion
-
 Romania
-
 Rwanda
-
 Saudi Arabia
-
 Serbia
-
 Singapore
-
 Slovakia
-
 Slovenia
-
 Somalia
-
 South Africa
-
 Spain
-
 Sri Lanka
-
 Sweden
-
 Switzerland
-
 Syria
-
 Taiwan
-
 Tajikistan
-
 Tanzania
-
 Thailand
-
 Trinidad and Tobago
-
 Tunisia
-
 Turkey
-
 UAE
-
 Uganda
-
 Ukraine
-
 United Kingdom
-
United States
-
 Uruguay
-
 Uzbekistan
-
 Venezuela
-
 Vietnam
-
 Yemen
-
 Zambia
-
 Zimbabwe
- Forex
- Crypto












