

Bitcoin technical analysis: Seller pressure and oversold Stoch RSI near $74,659 support

Bitcoin (BTC) is trading at $74,815, posting a slight gain on the day. The asset remains below short- and medium-term moving averages but stays above longer-term trend levels.
 60352.16
65696.16
Highlights
- Spot Bitcoin ETFs saw $1.28 billion in outflows last week, the largest since late June, as institutional demand fell.
- BlackRock’s iShares Bitcoin Trust accounted for $1.21 billion of the outflows, turning 2026 cumulative ETF flows negative amid US regulatory scrutiny.
- Bitcoin trades below key short- and medium-term moving averages with indicators showing seller dominance and an expected range of $73,097 to $77,994 in coming days.
ETF outflows surge as regulatory scrutiny and rate fears mount
Spot Bitcoin ETFs recorded $1.28 billion in outflows last week, their largest since late June, as institutional investors pulled back amid increased US regulatory scrutiny following recent political developments, according to Yahoo Finance and other sources. This withdrawal was led by BlackRock’s iShares Bitcoin Trust, which accounted for $1.21 billion of the outflows, directly reducing institutional demand and pushing cumulative ETF flows for 2026 into negative territory. Separately, broader market disruptions were triggered by $1 billion in position liquidations linked to a regulatory probe into Nvidia and mounting fears of stricter oversight, as reported by Bitcoinmagazine. In addition, stronger US jobs data has heightened expectations of a December Federal Reserve rate hike, further moderating risk appetite across digital assets.
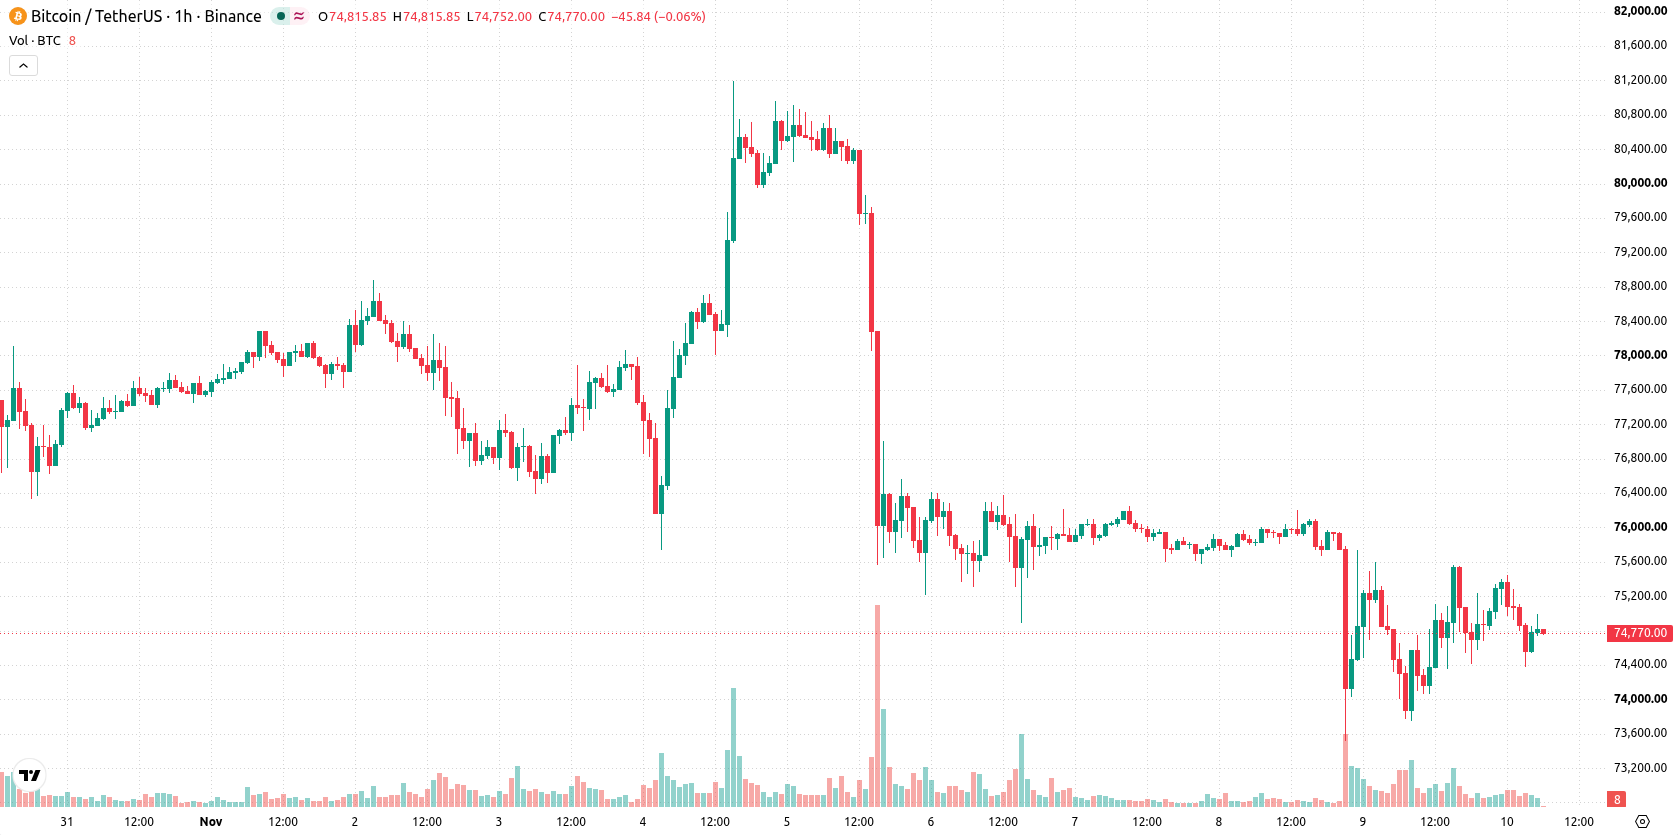
Seller momentum intensifies as BTC stays above long-term support
BTC is trading below the MA-20 at $74,851 and MA-50 at $75,187 on the hourly chart, while remaining above the MA-200 at $73,205 on the daily timeframe. The Ichimoku Kijun at $74,659 acts as the nearest support. On the indicator front, MACD is in Sell mode and ADX signals a neutral trend. RSI and CCI show neutral momentum, while Stochastic RSI is oversold, suggesting some selling exhaustion amid prevailing intraday weakness. Bull/Bear Power stands at -131.19, reflecting stronger seller dominance, and the Awesome Oscillator remains neutral.
Downside risk elevated as price holds within defined trading band
In the short term, BTC is likely to remain confined within the $73,097 to $77,994 range, reflecting typical volatility bands relative to current levels. The probability of a downside move remains significantly higher than a rebound, with a low likelihood of a sustained upward reversal unless price decisively breaks above resistance. If support at the lower end of the corridor is breached, further downside pressure could materialize, while a confirmed move above resistance would be required to reestablish a bullish trajectory.
Previously it was reported that major corporate holders continued to expand their Bitcoin reserves despite declining institutional appetite reflected in ETF outflows. The current data reinforce this dynamic, highlighting persistent downside risks and signaling that any durable recovery will depend on a clear shift in institutional flows or a decisive break above the established resistance band.











-
 Afghanistan
-
 Albania
-
 Algeria
-
 Angola
-
 Argentina
-
 Armenia
-
 Australia
-
 Austria
-
 Azerbaijan
-
 Bahamas
-
 Bahrain
-
 Bangladesh
-
 Belarus
-
 Belgium
-
 Bolivia
-
 Botswana
-
 Brazil
-
 Brunei
-
 Bulgaria
-
 Cambodia
-
 Cameroon
-
 Canada
-
 Chile
-
 China
-
 Colombia
-
 Congo
-
 Costa Rica
-
 Cote d'Ivoire
-
 Croatia
-
 Cuba
-
 Cyprus
-
 Czechia
-
 DR Congo
-
 Denmark
-
 Dominican Republic
-
 Ecuador
-
 Egypt
-
 El Salvador
-
 Estonia
-
 Eswatini
-
 Ethiopia
-
 Finland
-
 France
-
 Georgia
-
 Germany
-
 Ghana
-
 Greece
-
 Haiti
-
 Hong Kong
-
 Hungary
-
 India
-
 Indonesia
-
 Iran, Islamic republic
-
 Iraq
-
 Ireland
-
 Israel
-
 Italy
-
 Jamaica
-
 Japan
-
 Jordan
-
 Kazakhstan
-
 Kenya
-
 Korea
-
 Kuwait
-
 Kyrgyzstan
-
 Laos
-
 Latvia
-
 Lebanon
-
 Lesotho
-
 Libya
-
 Lithuania
-
 Luxembourg
-
 Madagascar
-
 Malaysia
-
 Malta
-
 Mauritius
-
 Mexico
-
 Moldova
-
 Mongolia
-
 Montenegro
-
 Morocco
-
 Mozambique
-
 Myanmar
-
 Namibia
-
 Nepal
-
 Netherlands
-
 New Zealand
-
 Nigeria
-
 North Macedonia
-
 Norway
-
 Oman
-
 Pakistan
-
 Palestine
-
 Panama
-
 Papua New Guinea
-
 Paraguay
-
 Peru
-
 Philippines
-
 Poland
-
 Portugal
-
 Puerto Rico
-
 Qatar
-
 Reunion
-
 Romania
-
 Rwanda
-
 Saudi Arabia
-
 Serbia
-
 Singapore
-
 Slovakia
-
 Slovenia
-
 Somalia
-
 South Africa
-
 Spain
-
 Sri Lanka
-
 Sweden
-
 Switzerland
-
 Syria
-
 Taiwan
-
 Tajikistan
-
 Tanzania
-
 Thailand
-
 Trinidad and Tobago
-
 Tunisia
-
 Turkey
-
 UAE
-
 Uganda
-
 Ukraine
-
 United Kingdom
-
United States
-
 Uruguay
-
 Uzbekistan
-
 Venezuela
-
 Vietnam
-
 Yemen
-
 Zambia
-
 Zimbabwe
- Forex
- Crypto












