

Ethereum ETF outflows and treasury sale: ETH remains under pressure

Ethereum (ETH) is trading at $2,051, showing a modest decline for the session. The price currently sits below its key moving averages, highlighting persistent downside momentum in both the short and longer term.
 1811.44
2021.11
Highlights
- Spot Ethereum ETFs saw a net outflow of $1.3 million on November 10, 2026, with $2 million exiting the Grayscale Ethereum Trust ETF.
- The Ethereum Foundation sold 1,000 ETH for $2.03 million, adding to recent market sell-side activity from its treasury.
- ETH/USD trades below key moving averages with strong downside momentum, projected to consolidate between $1,867 to $2,107 as bears dominate.
Institutional outflows and treasury sale intensify sell-side pressure
Spot Ethereum exchange-traded funds recorded a net outflow of $1.3 million on November 10, 2026, including a substantial $2 million outflow from the Grayscale Ethereum Trust ETF, representing a clear reduction in institutional exposure and liquidity, according to SoSoValue. At the same time, the Ethereum Foundation moved 1,000 ETH from its treasury, selling the assets for $2.03 million, which added to prevailing sell-side pressure as noted in recent wallet activity. Meanwhile, Ethlabs announced a proposal to strengthen Ethereum's defenses against quantum computing and artificial intelligence risks, an initiative highlighted by Bloomingbit that may guide longer-term sentiment but has not yet impacted short-term flows.
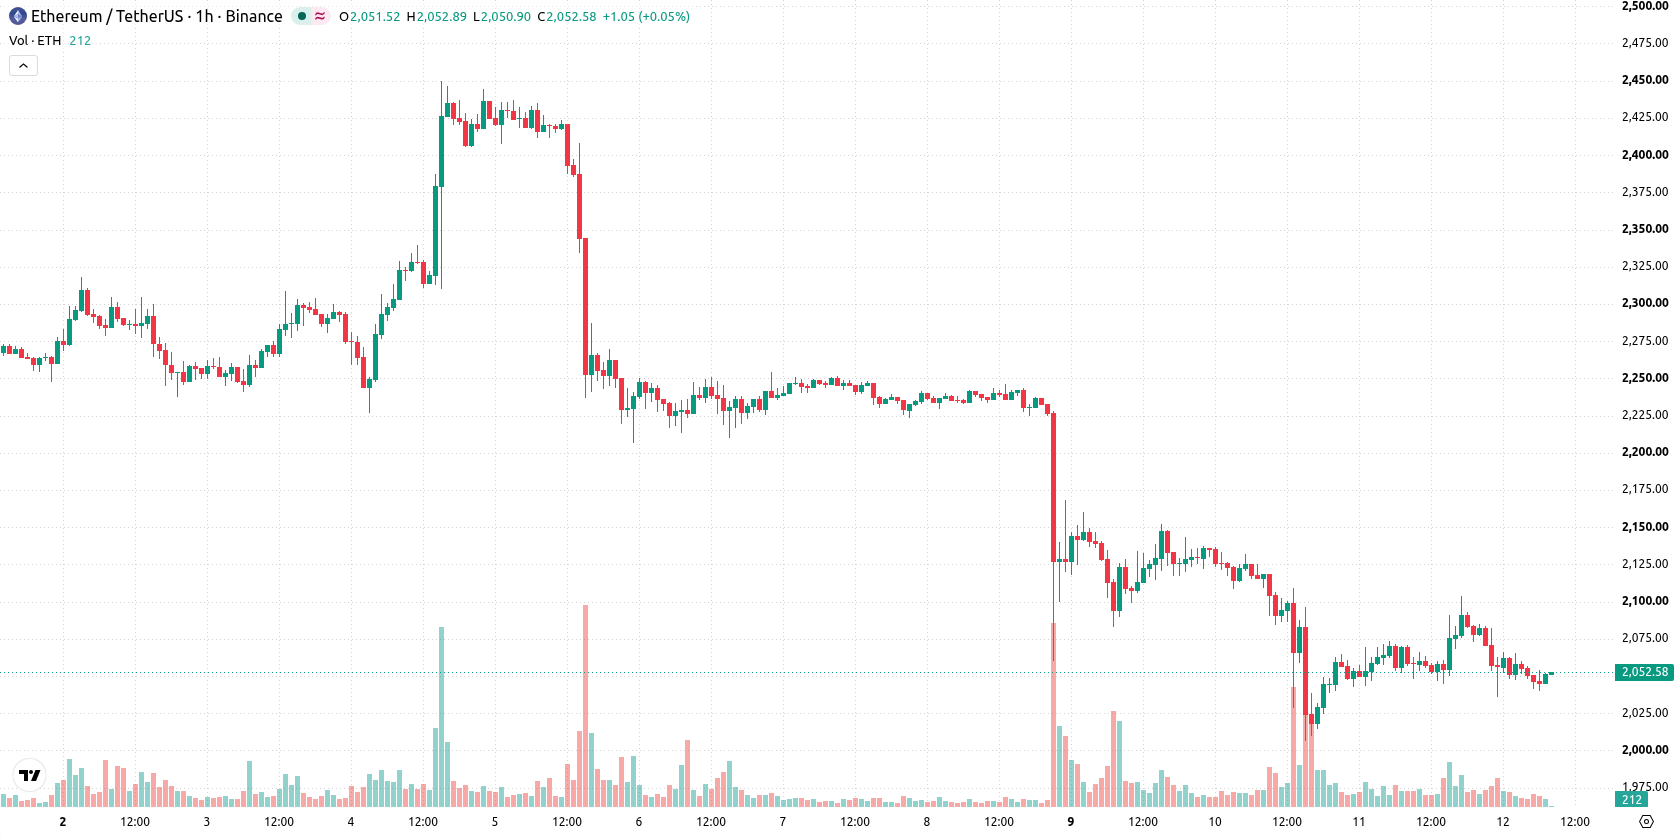
Bearish control as ETH tests resistance with weak momentum signals
On the technical front, ETH trades below the MA-20 and MA-50 on the hourly chart and remains under the MA-200 on the daily timeframe, confirming sustained pressure across timeframes. The Ichimoku Kijun at $2,069 acts as immediate resistance, while momentum indicators such as MACD and ADX remain weak. Both RSI and CCI are neutral, though the Stochastic RSI has dropped into its oversold zone. Bull/Bear Power is negative, and the Awesome Oscillator is aligned with bearish momentum, confirming that sellers remain in control intraday.
Downtrend risk elevated as ETH rangebound amid resistance
Looking ahead, ETH is expected to remain within a trading band of $1,867 to $2,107, reflecting typical volatility relative to current levels. The probability of an upward breakout is rated very low, while the likelihood of further downside is high, suggesting that any short-term rebounds may face considerable resistance. If the price moves above the $2,069 Kijun resistance, a reversal could develop, while a break below $1,867 would likely trigger a deeper extension of the downtrend. The baseline scenario favors continued consolidation inside the forecast range.
Earlier, analysts noted that persistent ETF outflows and large-holder selling had kept Ethereum under pressure, leaving its recovery highly dependent on easing sell-side dynamics and improved institutional flows. The latest data strengthens that view, as continued outflows and renewed foundation selling reinforce downside risks, making the $1,867 support a critical level to watch for any further decline.











-
 Afghanistan
-
 Albania
-
 Algeria
-
 Angola
-
 Argentina
-
 Armenia
-
 Australia
-
 Austria
-
 Azerbaijan
-
 Bahamas
-
 Bahrain
-
 Bangladesh
-
 Belarus
-
 Belgium
-
 Bolivia
-
 Botswana
-
 Brazil
-
 Brunei
-
 Bulgaria
-
 Cambodia
-
 Cameroon
-
 Canada
-
 Chile
-
 China
-
 Colombia
-
 Congo
-
 Costa Rica
-
 Cote d'Ivoire
-
 Croatia
-
 Cuba
-
 Cyprus
-
 Czechia
-
 DR Congo
-
 Denmark
-
 Dominican Republic
-
 Ecuador
-
 Egypt
-
 El Salvador
-
 Estonia
-
 Eswatini
-
 Ethiopia
-
 Finland
-
 France
-
 Georgia
-
 Germany
-
 Ghana
-
 Greece
-
 Haiti
-
 Hong Kong
-
 Hungary
-
 India
-
 Indonesia
-
 Iran, Islamic republic
-
 Iraq
-
 Ireland
-
 Israel
-
 Italy
-
 Jamaica
-
 Japan
-
 Jordan
-
 Kazakhstan
-
 Kenya
-
 Korea
-
 Kuwait
-
 Kyrgyzstan
-
 Laos
-
 Latvia
-
 Lebanon
-
 Lesotho
-
 Libya
-
 Lithuania
-
 Luxembourg
-
 Madagascar
-
 Malaysia
-
 Malta
-
 Mauritius
-
 Mexico
-
 Moldova
-
 Mongolia
-
 Montenegro
-
 Morocco
-
 Mozambique
-
 Myanmar
-
 Namibia
-
 Nepal
-
 Netherlands
-
 New Zealand
-
 Nigeria
-
 North Macedonia
-
 Norway
-
 Oman
-
 Pakistan
-
 Palestine
-
 Panama
-
 Papua New Guinea
-
 Paraguay
-
 Peru
-
 Philippines
-
 Poland
-
 Portugal
-
 Puerto Rico
-
 Qatar
-
 Reunion
-
 Romania
-
 Rwanda
-
 Saudi Arabia
-
 Serbia
-
 Singapore
-
 Slovakia
-
 Slovenia
-
 Somalia
-
 South Africa
-
 Spain
-
 Sri Lanka
-
 Sweden
-
 Switzerland
-
 Syria
-
 Taiwan
-
 Tajikistan
-
 Tanzania
-
 Thailand
-
 Trinidad and Tobago
-
 Tunisia
-
 Turkey
-
 UAE
-
 Uganda
-
 Ukraine
-
 United Kingdom
-
United States
-
 Uruguay
-
 Uzbekistan
-
 Venezuela
-
 Vietnam
-
 Yemen
-
 Zambia
-
 Zimbabwe
- Forex
- Crypto












