

Pepe falls over 15% as sellers dominate amid heightened meme coin trading and volatility

Pepe (PEPE) dropped 15.05% after sellers took control following a surge in meme coin trading activity and significant trading volumes. The decline is reinforced by the price remaining below its 20-day moving average, even as intermediate and long-term trends hold a bullish bias.
 0.0540
0.055520
Highlights
- Trading volume for PEPE reached $543 million, with the token posting positive daily moves in 60% of the last 30 days.
- Justin Sun is now the top individual holder and an S-1 filing for a spot PEPE ETF was announced on May 25, leading to a temporary price dip.
- PEPE trades below short-term technical resistance with momentum signals mixed and an expected five-day range of $0.000003945 to $0.00000518.
Volume spike and ETF news fuel volatility amid ongoing selloff
Pepe, the Ethereum-based frog-themed memecoin, has recently seen heightened trading activity and momentum as trading volume reached $543 million amid increased meme coin interest. The token has exhibited positive daily performance in 60% of the last 30 days and displayed high price volatility. Notably, crypto figure Justin Sun became the top individual holder, and an S-1 filing for a spot PEPE ETF was announced on May 25, which previously led to a temporary price dip, though price action has remained under broader selling pressure.
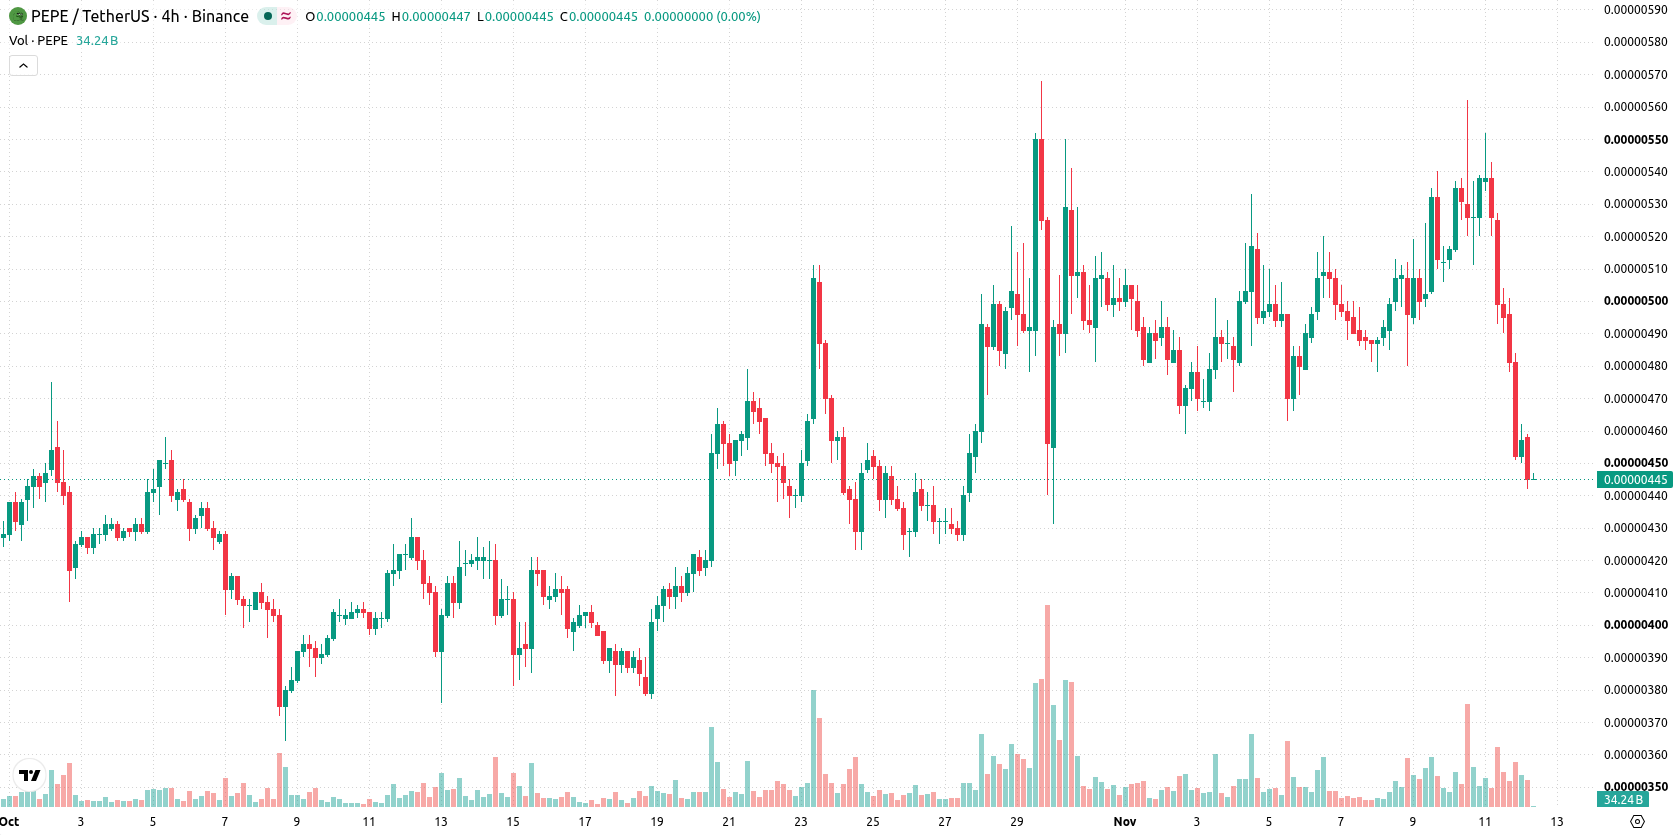
Short-term selling outweighs mixed technical signals and volatile range
PEPE/USD is trading below its 20-day moving average at $0.000004813 but remains above the 50-day ($0.000004463) and 200-day ($0.000003544) moving averages. This configuration points to short-term selling pressure within a medium- and long-term bullish structure. Support is established at $0.000004463, with a nearby resistance level at $0.00000451. Technical indicators are mixed: the MACD signals strong buy momentum and the ADX confirms an active trend, while the RSI and CCI remain neutral. The Stochastic RSI sits in the oversold zone, indicating possible rebound potential. Bull/Bear Power (BBP) is positive, suggesting intraday buyers are dominant, although the current intraday picture is marked by selling pressure and increased volatility. Divergent momentum signals and price volatility at 4.55% reflect a market under short-term strain, with price currently mid-range on the session.
Earlier, analysts noted that intensifying short-term bearish pressure was dominating Pepe after a series of forced long liquidations. The latest trading session introduces a possible shift, as technical signals now point to an active trend and potential for upward volatility, making price action around the $0.00000451 resistance a critical area to monitor in the days ahead.






Latest PEPE/USD News




-
 Afghanistan
-
 Albania
-
 Algeria
-
 Angola
-
 Argentina
-
 Armenia
-
 Australia
-
 Austria
-
 Azerbaijan
-
 Bahamas
-
 Bahrain
-
 Bangladesh
-
 Belarus
-
 Belgium
-
 Bolivia
-
 Botswana
-
 Brazil
-
 Brunei
-
 Bulgaria
-
 Cambodia
-
 Cameroon
-
 Canada
-
 Chile
-
 China
-
 Colombia
-
 Congo
-
 Costa Rica
-
 Cote d'Ivoire
-
 Croatia
-
 Cuba
-
 Cyprus
-
 Czechia
-
 DR Congo
-
 Denmark
-
 Dominican Republic
-
 Ecuador
-
 Egypt
-
 El Salvador
-
 Estonia
-
 Eswatini
-
 Ethiopia
-
 Finland
-
 France
-
 Georgia
-
 Germany
-
 Ghana
-
 Greece
-
 Haiti
-
 Hong Kong
-
 Hungary
-
 India
-
 Indonesia
-
 Iran, Islamic republic
-
 Iraq
-
 Ireland
-
 Israel
-
 Italy
-
 Jamaica
-
 Japan
-
 Jordan
-
 Kazakhstan
-
 Kenya
-
 Korea
-
 Kuwait
-
 Kyrgyzstan
-
 Laos
-
 Latvia
-
 Lebanon
-
 Lesotho
-
 Libya
-
 Lithuania
-
 Luxembourg
-
 Madagascar
-
 Malaysia
-
 Malta
-
 Mauritius
-
 Mexico
-
 Moldova
-
 Mongolia
-
 Montenegro
-
 Morocco
-
 Mozambique
-
 Myanmar
-
 Namibia
-
 Nepal
-
 Netherlands
-
 New Zealand
-
 Nigeria
-
 North Macedonia
-
 Norway
-
 Oman
-
 Pakistan
-
 Palestine
-
 Panama
-
 Papua New Guinea
-
 Paraguay
-
 Peru
-
 Philippines
-
 Poland
-
 Portugal
-
 Puerto Rico
-
 Qatar
-
 Reunion
-
 Romania
-
 Rwanda
-
 Saudi Arabia
-
 Serbia
-
 Singapore
-
 Slovakia
-
 Slovenia
-
 Somalia
-
 South Africa
-
 Spain
-
 Sri Lanka
-
 Sweden
-
 Switzerland
-
 Syria
-
 Taiwan
-
 Tajikistan
-
 Tanzania
-
 Thailand
-
 Trinidad and Tobago
-
 Tunisia
-
 Turkey
-
 UAE
-
 Uganda
-
 Ukraine
-
 United Kingdom
-
United States
-
 Uruguay
-
 Uzbekistan
-
 Venezuela
-
 Vietnam
-
 Yemen
-
 Zambia
-
 Zimbabwe
- Forex
- Crypto












