

Optimism falls amid sustained seller pressure across all timeframes

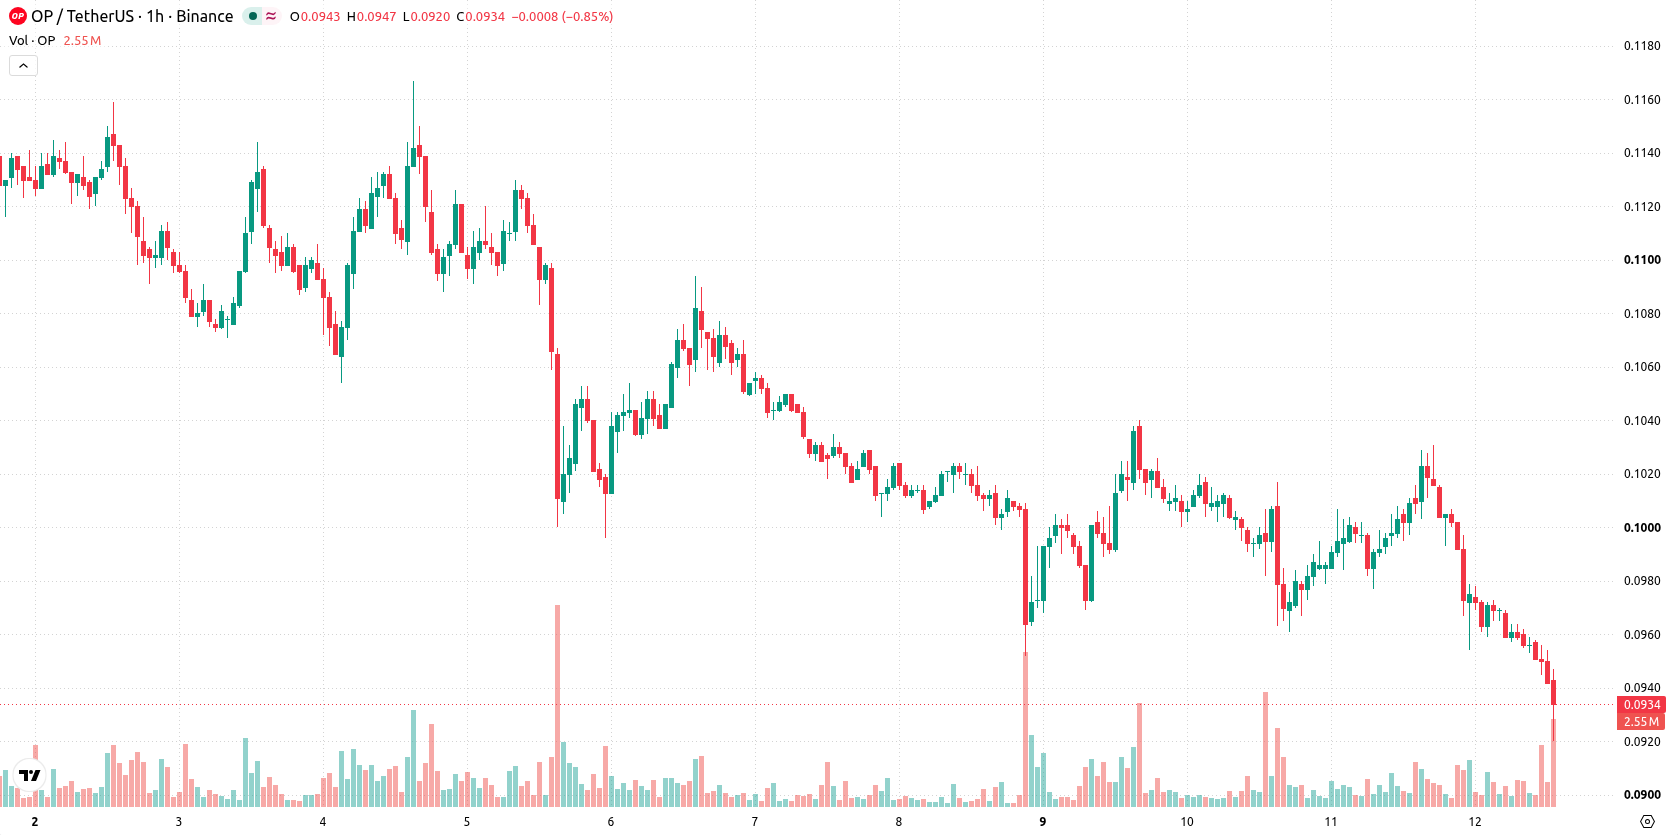
Optimism (OP) is trading at $0.0928, down 7.2% on the day and hovering near session lows. The token is currently positioned below its key moving averages, reflecting ongoing selling activity.
 0.093
0.1040
Highlights
- Pump.fun now supports Optimism tokens, allowing direct access and trading of new and existing tokens within the Optimism ecosystem.
- This expansion is set to increase OP token utility and liquidity, broadening reach for users and potentially boosting short-term trading activity.
- OP trades below key moving averages with strong bearish momentum signals and sellers dominating; price is expected in the $0.0896 to $0.0962 range with a very high probability of further downside.
Trading app support boosts access but price stays under pressure
Pump.fun has announced support for Optimism (OP) tokens within its trading app, enabling users to access and trade both new and existing tokens in the Optimism ecosystem without the need for manual bridging, according to Tokenpost. This development increases the utility and liquidity of OP by simplifying token access for a wider user base, potentially encouraging short-term trading interest. However, despite the positive implications of improved ecosystem functionality, recent price action has remained under broader selling pressure.
Seller momentum confirmed as OP fails at resistance amid bearish signals
On the hourly chart, OP/USD trades below the MA-20, MA-50, and MA-200, reflecting short-, medium-, and long-term seller dominance. The Ichimoku Kijun at $0.0988 is the immediate resistance level. Both MACD and ADX are set to Sell, while indicator readings for RSI, Stoch RSI, and CCI are neutral, offering no overbought or oversold signals. Bull/Bear Power is negative and the Awesome Oscillator also supports the bearish setup, with all major momentum signals aligning with the underlying downside bias.
Further downside risk seen as rebound chances remain limited
In the near term, OP is expected to trade between $0.0896 and $0.0962. The probability of a move higher is very low, while chances for further downside are significant, making a continued decline far more likely than a rebound. A break above the $0.0988 resistance would be required to open any bullish scenario in the coming sessions, while a drop below $0.0896 could lead to additional downside within a typical volatility band.
Earlier, analysts noted that Optimism was exhibiting persistent downside pressure, with technical signals pointing toward a prevailing bearish trend. Current indicators confirm this negative setup and suggest that a break below $0.0896 would heighten downside risk and expose lower price levels in the sessions ahead.









-
 Afghanistan
-
 Albania
-
 Algeria
-
 Angola
-
 Argentina
-
 Armenia
-
 Australia
-
 Austria
-
 Azerbaijan
-
 Bahamas
-
 Bahrain
-
 Bangladesh
-
 Belarus
-
 Belgium
-
 Bolivia
-
 Botswana
-
 Brazil
-
 Brunei
-
 Bulgaria
-
 Cambodia
-
 Cameroon
-
 Canada
-
 Chile
-
 China
-
 Colombia
-
 Congo
-
 Costa Rica
-
 Cote d'Ivoire
-
 Croatia
-
 Cuba
-
 Cyprus
-
 Czechia
-
 DR Congo
-
 Denmark
-
 Dominican Republic
-
 Ecuador
-
 Egypt
-
 El Salvador
-
 Estonia
-
 Eswatini
-
 Ethiopia
-
 Finland
-
 France
-
 Georgia
-
 Germany
-
 Ghana
-
 Greece
-
 Haiti
-
 Hong Kong
-
 Hungary
-
 India
-
 Indonesia
-
 Iran, Islamic republic
-
 Iraq
-
 Ireland
-
 Israel
-
 Italy
-
 Jamaica
-
 Japan
-
 Jordan
-
 Kazakhstan
-
 Kenya
-
 Korea
-
 Kuwait
-
 Kyrgyzstan
-
 Laos
-
 Latvia
-
 Lebanon
-
 Lesotho
-
 Libya
-
 Lithuania
-
 Luxembourg
-
 Madagascar
-
 Malaysia
-
 Malta
-
 Mauritius
-
 Mexico
-
 Moldova
-
 Mongolia
-
 Montenegro
-
 Morocco
-
 Mozambique
-
 Myanmar
-
 Namibia
-
 Nepal
-
 Netherlands
-
 New Zealand
-
 Nigeria
-
 North Macedonia
-
 Norway
-
 Oman
-
 Pakistan
-
 Palestine
-
 Panama
-
 Papua New Guinea
-
 Paraguay
-
 Peru
-
 Philippines
-
 Poland
-
 Portugal
-
 Puerto Rico
-
 Qatar
-
 Reunion
-
 Romania
-
 Rwanda
-
 Saudi Arabia
-
 Serbia
-
 Singapore
-
 Slovakia
-
 Slovenia
-
 Somalia
-
 South Africa
-
 Spain
-
 Sri Lanka
-
 Sweden
-
 Switzerland
-
 Syria
-
 Taiwan
-
 Tajikistan
-
 Tanzania
-
 Thailand
-
 Trinidad and Tobago
-
 Tunisia
-
 Turkey
-
 UAE
-
 Uganda
-
 Ukraine
-
 United Kingdom
-
United States
-
 Uruguay
-
 Uzbekistan
-
 Venezuela
-
 Vietnam
-
 Yemen
-
 Zambia
-
 Zimbabwe
- Forex
- Crypto












