

Enterprise adoption contrasts with price slide: Optimism weekly outlook: Can OP leverage growing institutional momentum?

Optimism (OP) has retreated to around $0.10 after falling more than 12% over the past week, as institutional adoption remains the dominant narrative. Even as selling pressure intensifies, enterprise-driven activity and growing protocol participation could shape the setup for the days ahead.
 0.1024
0.1167
Highlights
- Optimism trades at $0.101 after a 12.63% decline over 7 days, firmly below long-term trend measures.
- Current momentum and indicator signals remain negative, showing selling pressure dominates despite oversold conditions.
- Near-term range is $0.0919 to $0.1103, with immediate support at $0.0996 and risk skewed to further downside.
Governance reforms and enterprise integration sustain bullish narrative this week
Optimism proposed a new governance policy requiring at least 30 days' public notice before any chain can transfer upgrade authority away from its Security Council, a reform currently pending acceptance by the community, according to CryptoSlate. Meanwhile, major enterprises including Kraken, Uniswap Labs, and Sony's Soneium are expanding their use of OP Stack for their own blockchains, while OP Mainnet's total value locked has risen approximately 69.2% since January 1, 2026, as reported by Alea Research. Immutable also confirmed plans to migrate its Immutable Chain to OP Stack by mid-2027, signifying continued institutional and enterprise momentum for the Optimism framework (source: CryptoNews.net).
Downside momentum persists as technical signals confirm negative bias
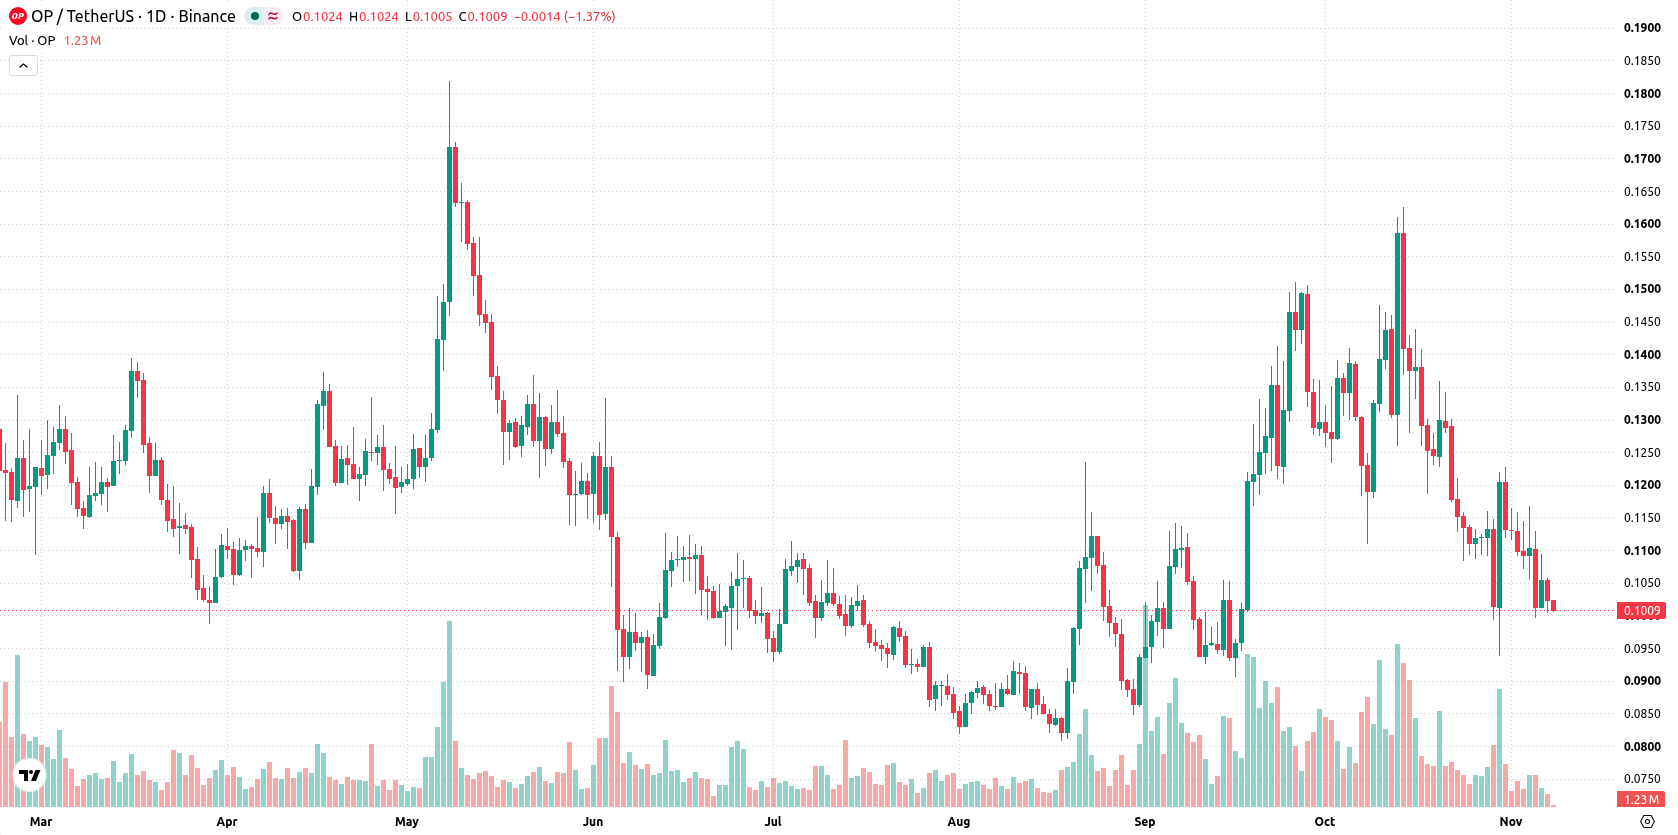
The daily chart shows a flat trend after a sharp move lower, with momentum remaining negative. MACD and Bull/Bear Power both signal downside pressure, while CCI is the only oscillator registering an oversold reading, suggesting some potential for an upside rebound. Overall momentum signals point to selling dominance despite neutral readings from other oscillators, and intraday volatility has been high at 17.17%. Immediate support is located at $0.0996, and resistance stands at $0.1117 (MA-200), with the Ichimoku Kijun at $0.1281 reinforcing overhead pressure.
Consolidation likely this week as supply pressure limits rebound risk
For the next 7 days, the expected range is $0.0919 to $0.1103. There is a very high probability of a further decrease and a very low probability of a rebound. The base case is consolidation inside this range, with supply pressure dominating near the lower end. A break above $0.1117 would improve the outlook toward resistance, while a loss of $0.0996 would reinforce bearish momentum and expose lower levels.
Earlier, analysts noted that Optimism was exhibiting persistent downside pressure and weak technicals that pointed to an ongoing bearish trend. The current outlook strengthens this view by highlighting sustained selling dominance and elevated volatility, making $0.0996 the immediate key level to watch for signs of further downside risk.










-
 Afghanistan
-
 Albania
-
 Algeria
-
 Angola
-
 Argentina
-
 Armenia
-
 Australia
-
 Austria
-
 Azerbaijan
-
 Bahamas
-
 Bahrain
-
 Bangladesh
-
 Belarus
-
 Belgium
-
 Bolivia
-
 Botswana
-
 Brazil
-
 Brunei
-
 Bulgaria
-
 Cambodia
-
 Cameroon
-
 Canada
-
 Chile
-
 China
-
 Colombia
-
 Congo
-
 Costa Rica
-
 Cote d'Ivoire
-
 Croatia
-
 Cuba
-
 Cyprus
-
 Czechia
-
 DR Congo
-
 Denmark
-
 Dominican Republic
-
 Ecuador
-
 Egypt
-
 El Salvador
-
 Estonia
-
 Eswatini
-
 Ethiopia
-
 Finland
-
 France
-
 Georgia
-
 Germany
-
 Ghana
-
 Greece
-
 Haiti
-
 Hong Kong
-
 Hungary
-
 India
-
 Indonesia
-
 Iran, Islamic republic
-
 Iraq
-
 Ireland
-
 Israel
-
 Italy
-
 Jamaica
-
 Japan
-
 Jordan
-
 Kazakhstan
-
 Kenya
-
 Korea
-
 Kuwait
-
 Kyrgyzstan
-
 Laos
-
 Latvia
-
 Lebanon
-
 Lesotho
-
 Libya
-
 Lithuania
-
 Luxembourg
-
 Madagascar
-
 Malaysia
-
 Malta
-
 Mauritius
-
 Mexico
-
 Moldova
-
 Mongolia
-
 Montenegro
-
 Morocco
-
 Mozambique
-
 Myanmar
-
 Namibia
-
 Nepal
-
 Netherlands
-
 New Zealand
-
 Nigeria
-
 North Macedonia
-
 Norway
-
 Oman
-
 Pakistan
-
 Palestine
-
 Panama
-
 Papua New Guinea
-
 Paraguay
-
 Peru
-
 Philippines
-
 Poland
-
 Portugal
-
 Puerto Rico
-
 Qatar
-
 Reunion
-
 Romania
-
 Rwanda
-
 Saudi Arabia
-
 Serbia
-
 Singapore
-
 Slovakia
-
 Slovenia
-
 Somalia
-
 South Africa
-
 Spain
-
 Sri Lanka
-
 Sweden
-
 Switzerland
-
 Syria
-
 Taiwan
-
 Tajikistan
-
 Tanzania
-
 Thailand
-
 Trinidad and Tobago
-
 Tunisia
-
 Turkey
-
 UAE
-
 Uganda
-
 Ukraine
-
 United Kingdom
-
United States
-
 Uruguay
-
 Uzbekistan
-
 Venezuela
-
 Vietnam
-
 Yemen
-
 Zambia
-
 Zimbabwe
- Forex
- Crypto












