

MACD signals sell momentum for OP as price struggles to break $0.122 resistance: weekly analysis

Optimism (OP) is holding near $0.113 as price action reflects a tug-of-war between mixed technical indicators and renewed ecosystem developments. Despite resistance limiting any meaningful advance, the setup remains defined by range-bound trading and conflicting momentum signals heading into the week.
 0.1164
0.1228
Highlights
- Optimism trades at $0.1128, consolidating near the 200-day moving average and remaining below short-term trend indicators.
- Technical signals are mixed, with oscillators showing neutral momentum and MACD indicating mild sell pressure, as volatility stands at 30.06%.
- Key support is at $0.1123 and resistance at $0.122, with an expected range of $0.0978 to $0.1277 in the coming week.
Governance fee refunds and Uniswap migration drive ecosystem optimism
The Optimism Foundation has introduced a governance proposal to refund Ethereum transaction fees to select OP Mainnet partners, aiming to boost activity on the network according to COINOTAG. This measure would cap refunds at each partner’s contributed fee revenue and be funded from ETH fees, not OP tokens, pending governance approval (source: TokenPost). Additionally, Uniswap’s Unichain mainnet migration to OP Enterprise is progressing, with Optimism taking on operational roles to further integrate the Superchain ecosystem (source: TokenPost).
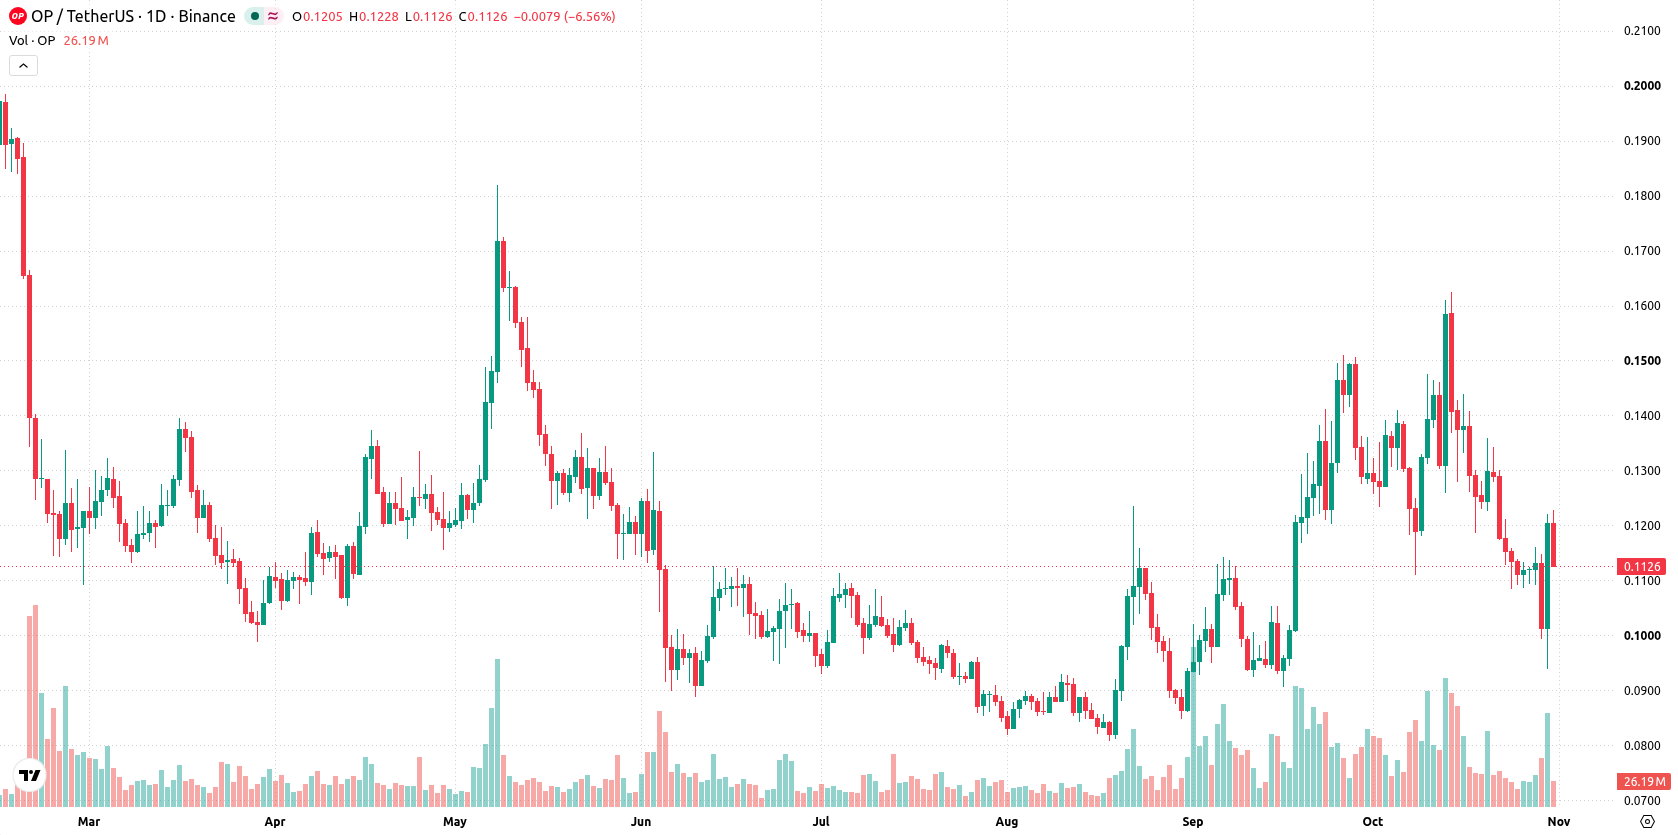
Mixed momentum prevails as support withstands pressure and oscillators stay neutral
The daily chart reflects developing trend conditions with volatility running at 30.06% and momentum characterized by a sharp move higher without a sustained trend. Oscillator signals are neutral across the board, with the RSI at 46.9027 and CCI approaching oversold but not in an extreme state. MACD signals sell momentum, while Bull/Bear Power remains barely positive. Key levels to watch are immediate support at $0.1123, where price is holding, and resistance at $0.122, with the Ichimoku Kijun at $0.1281 acting as another ceiling.
Upside bias holds as breakout scenarios depend on weekly resistance levels
In the week ahead, the expected range is $0.0978 to $0.1277, with a 67% probability of an increase versus a 33% chance of decline. The base case sees Optimism continuing to consolidate in a narrow band between current support and resistance. A break above $0.122 opens the door to further gains toward the $0.1277 area, while failure to hold above $0.1123 would expose downside risk toward $0.0978.
Earlier, analysts noted that Optimism was experiencing continued consolidation amid persistent selling pressure and mixed technical signals, despite long-term structural optimism. The current analysis reaffirms this indecisive setup and highlights the need to monitor a sustained break of the $0.122 resistance or a failure to hold above $0.1123 as potential triggers for a directional move.






Latest Optimism News




-
 Afghanistan
-
 Albania
-
 Algeria
-
 Angola
-
 Argentina
-
 Armenia
-
 Australia
-
 Austria
-
 Azerbaijan
-
 Bahamas
-
 Bahrain
-
 Bangladesh
-
 Belarus
-
 Belgium
-
 Bolivia
-
 Botswana
-
 Brazil
-
 Brunei
-
 Bulgaria
-
 Cambodia
-
 Cameroon
-
 Canada
-
 Chile
-
 China
-
 Colombia
-
 Congo
-
 Costa Rica
-
 Cote d'Ivoire
-
 Croatia
-
 Cuba
-
 Cyprus
-
 Czechia
-
 DR Congo
-
 Denmark
-
 Dominican Republic
-
 Ecuador
-
 Egypt
-
 El Salvador
-
 Estonia
-
 Eswatini
-
 Ethiopia
-
 Finland
-
 France
-
 Georgia
-
 Germany
-
 Ghana
-
 Greece
-
 Haiti
-
 Hong Kong
-
 Hungary
-
 India
-
 Indonesia
-
 Iran, Islamic republic
-
 Iraq
-
 Ireland
-
 Israel
-
 Italy
-
 Jamaica
-
 Japan
-
 Jordan
-
 Kazakhstan
-
 Kenya
-
 Korea
-
 Kuwait
-
 Kyrgyzstan
-
 Laos
-
 Latvia
-
 Lebanon
-
 Lesotho
-
 Libya
-
 Lithuania
-
 Luxembourg
-
 Madagascar
-
 Malaysia
-
 Malta
-
 Mauritius
-
 Mexico
-
 Moldova
-
 Mongolia
-
 Montenegro
-
 Morocco
-
 Mozambique
-
 Myanmar
-
 Namibia
-
 Nepal
-
 Netherlands
-
 New Zealand
-
 Nigeria
-
 North Macedonia
-
 Norway
-
 Oman
-
 Pakistan
-
 Palestine
-
 Panama
-
 Papua New Guinea
-
 Paraguay
-
 Peru
-
 Philippines
-
 Poland
-
 Portugal
-
 Puerto Rico
-
 Qatar
-
 Reunion
-
 Romania
-
 Rwanda
-
 Saudi Arabia
-
 Serbia
-
 Singapore
-
 Slovakia
-
 Slovenia
-
 Somalia
-
 South Africa
-
 Spain
-
 Sri Lanka
-
 Sweden
-
 Switzerland
-
 Syria
-
 Taiwan
-
 Tajikistan
-
 Tanzania
-
 Thailand
-
 Trinidad and Tobago
-
 Tunisia
-
 Turkey
-
 UAE
-
 Uganda
-
 Ukraine
-
 United Kingdom
-
United States
-
 Uruguay
-
 Uzbekistan
-
 Venezuela
-
 Vietnam
-
 Yemen
-
 Zambia
-
 Zimbabwe
- Forex
- Crypto












