

Optimism price prediction: Downward move may continue if $0.0748 support gives way

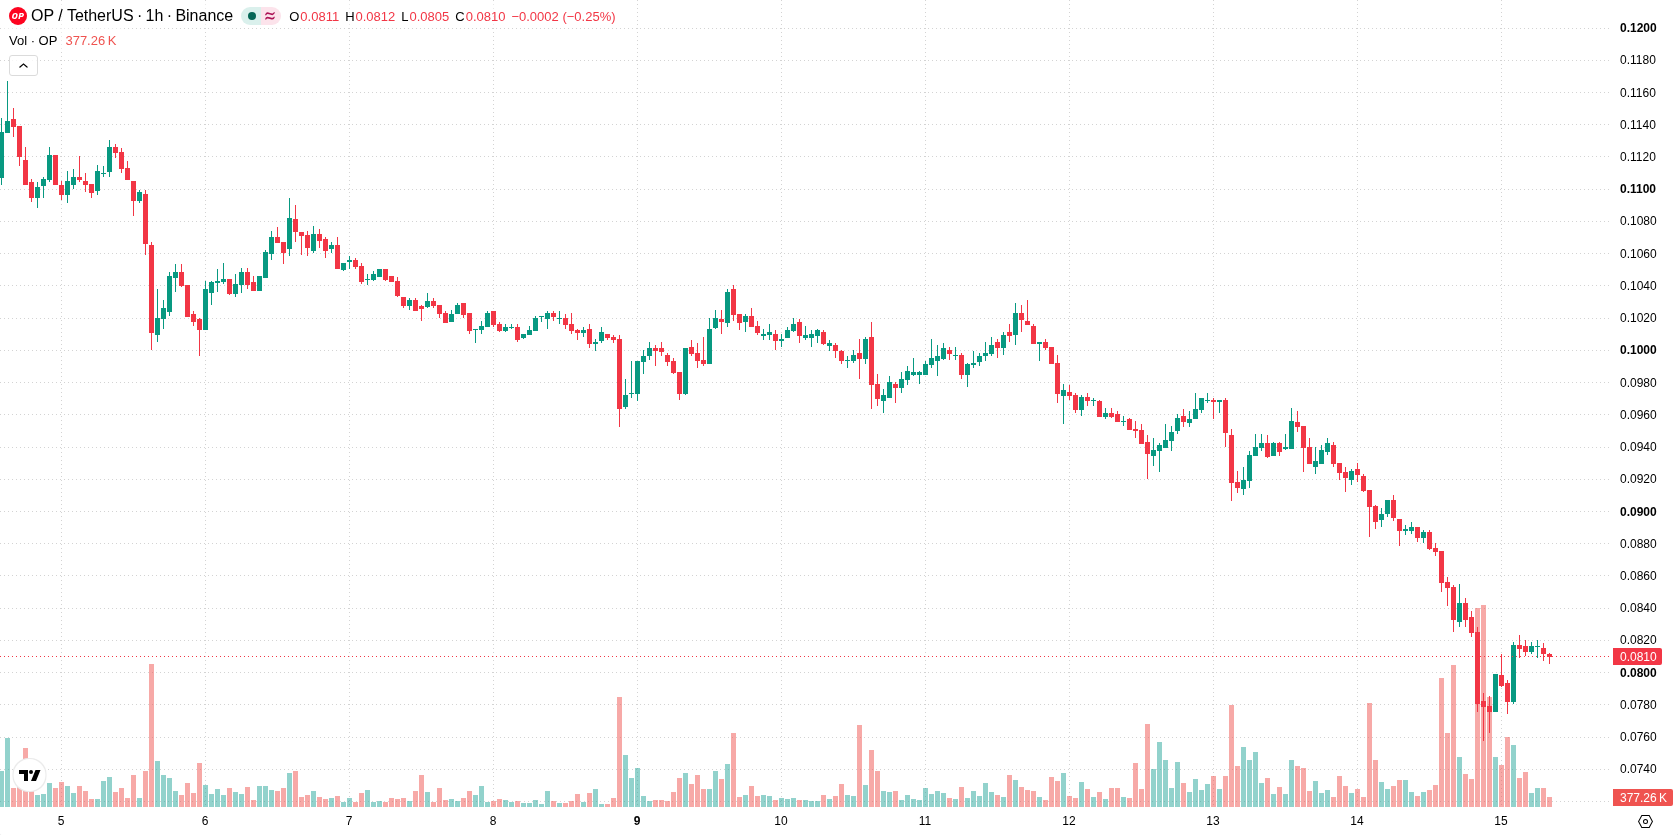
Optimism (OP) is trading at $0.0811, showing a sharp 8.47% decline over the past 24 hours. The price sits below its key moving averages, highlighting ongoing downside momentum.
 0.0823
0.1040
Highlights
- OP/USD has fallen 8.47% to $0.0811, trading below key moving averages across all timeframes.
- Technical indicators are mostly bearish, but some oscillators are neutral or overbought, suggesting potential short-term exhaustion.
- Expected trading range is $0.0748 to $0.0874, with a higher probability of further downside unless price clears $0.0834 resistance.
Bearish signals persist amid near-term exhaustion and mixed momentum
On the hourly chart, OP is positioned below both the MA-20 and MA-50, while the daily chart shows the price remains under the MA-200. The immediate resistance level is defined by the Ichimoku Kijun at $0.0834. Bearish momentum is confirmed by the MACD (Strong Sell) and ADX (Sell), while the RSI and CCI hold neutral stances. The Stochastic RSI is overbought, pointing to near-term exhaustion risk, while Bull/Bear Power is marginally positive. The Awesome Oscillator registers a neutral reading. Despite sharply lower prices, the asset is trading close to today’s session high amid heightened volatility, and mixed oscillator signals warrant caution.
Low rebound odds as volatility and downside risk intensify
Over the next trading day, OP is likely to fluctuate within a broad range between $0.0748 and $0.0874. The probability of upside movement remains very low, with a pronounced risk of further downside below support. A sustained rebound would require a decisive breakout above $0.0834, while a close below $0.0748 would likely trigger additional declines. The baseline expectation is continued volatile, range-bound action within the identified band.
Earlier, analysts noted that persistent downside momentum and heightened volatility were putting sustained pressure on Optimism’s price action. The current technical landscape confirms these ongoing risks, making the $0.0834 resistance a critical level to monitor for any potential bullish reversal.










-
 Afghanistan
-
 Albania
-
 Algeria
-
 Angola
-
 Argentina
-
 Armenia
-
 Australia
-
 Austria
-
 Azerbaijan
-
 Bahamas
-
 Bahrain
-
 Bangladesh
-
 Belarus
-
 Belgium
-
 Bolivia
-
 Botswana
-
 Brazil
-
 Brunei
-
 Bulgaria
-
 Cambodia
-
 Cameroon
-
 Canada
-
 Chile
-
 China
-
 Colombia
-
 Congo
-
 Costa Rica
-
 Cote d'Ivoire
-
 Croatia
-
 Cuba
-
 Cyprus
-
 Czechia
-
 DR Congo
-
 Denmark
-
 Dominican Republic
-
 Ecuador
-
 Egypt
-
 El Salvador
-
 Estonia
-
 Eswatini
-
 Ethiopia
-
 Finland
-
 France
-
 Georgia
-
 Germany
-
 Ghana
-
 Greece
-
 Haiti
-
 Hong Kong
-
 Hungary
-
 India
-
 Indonesia
-
 Iran, Islamic republic
-
 Iraq
-
 Ireland
-
 Israel
-
 Italy
-
 Jamaica
-
 Japan
-
 Jordan
-
 Kazakhstan
-
 Kenya
-
 Korea
-
 Kuwait
-
 Kyrgyzstan
-
 Laos
-
 Latvia
-
 Lebanon
-
 Lesotho
-
 Libya
-
 Lithuania
-
 Luxembourg
-
 Madagascar
-
 Malaysia
-
 Malta
-
 Mauritius
-
 Mexico
-
 Moldova
-
 Mongolia
-
 Montenegro
-
 Morocco
-
 Mozambique
-
 Myanmar
-
 Namibia
-
 Nepal
-
 Netherlands
-
 New Zealand
-
 Nigeria
-
 North Macedonia
-
 Norway
-
 Oman
-
 Pakistan
-
 Palestine
-
 Panama
-
 Papua New Guinea
-
 Paraguay
-
 Peru
-
 Philippines
-
 Poland
-
 Portugal
-
 Puerto Rico
-
 Qatar
-
 Reunion
-
 Romania
-
 Rwanda
-
 Saudi Arabia
-
 Serbia
-
 Singapore
-
 Slovakia
-
 Slovenia
-
 Somalia
-
 South Africa
-
 Spain
-
 Sri Lanka
-
 Sweden
-
 Switzerland
-
 Syria
-
 Taiwan
-
 Tajikistan
-
 Tanzania
-
 Thailand
-
 Trinidad and Tobago
-
 Tunisia
-
 Turkey
-
 UAE
-
 Uganda
-
 Ukraine
-
 United Kingdom
-
United States
-
 Uruguay
-
 Uzbekistan
-
 Venezuela
-
 Vietnam
-
 Yemen
-
 Zambia
-
 Zimbabwe
- Forex
- Crypto












