

Optimism technical analysis: Downward price move persists as volatility remains elevated

Optimism (OP) is trading at $0.1032 after declining 8.99% on the day, with the move taking the asset below its key moving averages on both hourly and daily timeframes. The price action reflects sustained selling pressure for the session.
 0.0708
0.0821
Highlights
- Applications running on Optimism's OP Stack chains generated over $500 million in revenue in the first half of 2026, showing strong realized demand.
- OP Mainnet's total value locked rose from $285.8 million at the end of 2025 to $483.4 million by September 30, 2026, indicating increased user participation and asset allocation.
- OP/USD trades below key moving averages with most indicators in oversold conditions and is projected to consolidate between $0.0967 and $0.1099 over the next few days.
Ecosystem growth accelerates as network activity surges despite price pressure
Apps built on Optimism’s OP Stack chains recorded over $500 million in revenue during the first half of 2026, according to Coinfomania, evidencing substantial realized demand and financial activity within the ecosystem. This surge in project revenue underscores the growing utility of the network and highlights the expansion of Optimism-linked applications. Alongside this, OP Mainnet’s total value locked increased from $285.8 million at the end of 2025 to $483.4 million by September 30, 2026, as reported by Alearesearch Substack, signaling strong user engagement and elevated asset deployment across the protocol, though price action has remained under broader selling pressure.
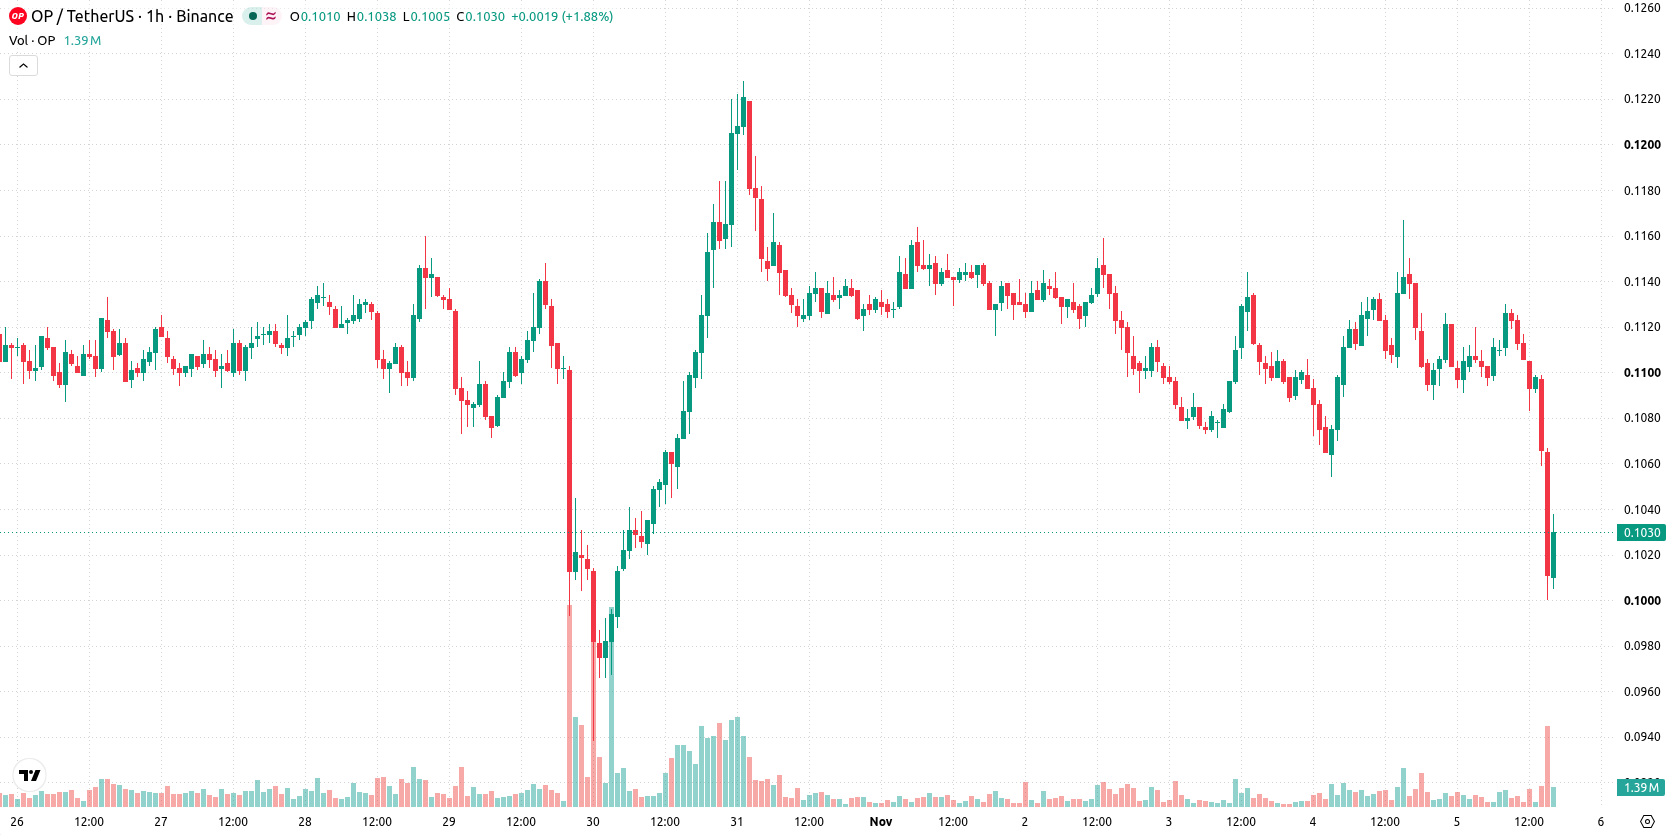
Downside momentum persists as technical benchmarks flag oversold conditions
On the technical front, OP/USD trades below the MA-20 ($0.1102) and MA-50 ($0.1105) on the hourly chart, and remains below the daily MA-200 at $0.112, with the Ichimoku Kijun at $0.1101 acting as immediate resistance. MACD signals a selling bias, while ADX is neutral, pointing to a lack of strong directional conviction. RSI, Stoch RSI, and CCI are each in oversold territory, suggesting a potential for mean reversion, but not providing confirmation of a rebound. Negative values for both Bull/Bear Power (-0.0026) and the Awesome Oscillator further support prevailing downside momentum, with price closing near session lows amid elevated volatility.
Further declines favored as technical weakness narrows bullish odds
Looking ahead to the next two to three trading days, OP/USD is expected to consolidate within a volatility band of $0.0967 to $0.1099. The probability of any sustained upward move remains very low, while the likelihood of further downside is high given recent technical weakness. The base scenario is for sideways trading inside the defined range. A bullish scenario would require a break above immediate resistance at $0.1101, whereas a drop below $0.0967 would open the door to further declines.
Earlier, analysts noted that Optimism was locked in a period of consolidation, with conflicting technical signals and the need for a decisive break to determine direction. The recent drop beneath key moving averages and oversold oscillator readings highlight mounting downside risk, making a sustained move below $0.0967 the primary level to watch for confirmation of further weakness.










-
 Afghanistan
-
 Albania
-
 Algeria
-
 Angola
-
 Argentina
-
 Armenia
-
 Australia
-
 Austria
-
 Azerbaijan
-
 Bahamas
-
 Bahrain
-
 Bangladesh
-
 Belarus
-
 Belgium
-
 Bolivia
-
 Botswana
-
 Brazil
-
 Brunei
-
 Bulgaria
-
 Cambodia
-
 Cameroon
-
 Canada
-
 Chile
-
 China
-
 Colombia
-
 Congo
-
 Costa Rica
-
 Cote d'Ivoire
-
 Croatia
-
 Cuba
-
 Cyprus
-
 Czechia
-
 DR Congo
-
 Denmark
-
 Dominican Republic
-
 Ecuador
-
 Egypt
-
 El Salvador
-
 Estonia
-
 Eswatini
-
 Ethiopia
-
 Finland
-
 France
-
 Georgia
-
 Germany
-
 Ghana
-
 Greece
-
 Haiti
-
 Hong Kong
-
 Hungary
-
 India
-
 Indonesia
-
 Iran, Islamic republic
-
 Iraq
-
 Ireland
-
 Israel
-
 Italy
-
 Jamaica
-
 Japan
-
 Jordan
-
 Kazakhstan
-
 Kenya
-
 Korea
-
 Kuwait
-
 Kyrgyzstan
-
 Laos
-
 Latvia
-
 Lebanon
-
 Lesotho
-
 Libya
-
 Lithuania
-
 Luxembourg
-
 Madagascar
-
 Malaysia
-
 Malta
-
 Mauritius
-
 Mexico
-
 Moldova
-
 Mongolia
-
 Montenegro
-
 Morocco
-
 Mozambique
-
 Myanmar
-
 Namibia
-
 Nepal
-
 Netherlands
-
 New Zealand
-
 Nigeria
-
 North Macedonia
-
 Norway
-
 Oman
-
 Pakistan
-
 Palestine
-
 Panama
-
 Papua New Guinea
-
 Paraguay
-
 Peru
-
 Philippines
-
 Poland
-
 Portugal
-
 Puerto Rico
-
 Qatar
-
 Reunion
-
 Romania
-
 Rwanda
-
 Saudi Arabia
-
 Serbia
-
 Singapore
-
 Slovakia
-
 Slovenia
-
 Somalia
-
 South Africa
-
 Spain
-
 Sri Lanka
-
 Sweden
-
 Switzerland
-
 Syria
-
 Taiwan
-
 Tajikistan
-
 Tanzania
-
 Thailand
-
 Trinidad and Tobago
-
 Tunisia
-
 Turkey
-
 UAE
-
 Uganda
-
 Ukraine
-
 United Kingdom
-
United States
-
 Uruguay
-
 Uzbekistan
-
 Venezuela
-
 Vietnam
-
 Yemen
-
 Zambia
-
 Zimbabwe
- Forex
- Crypto












