


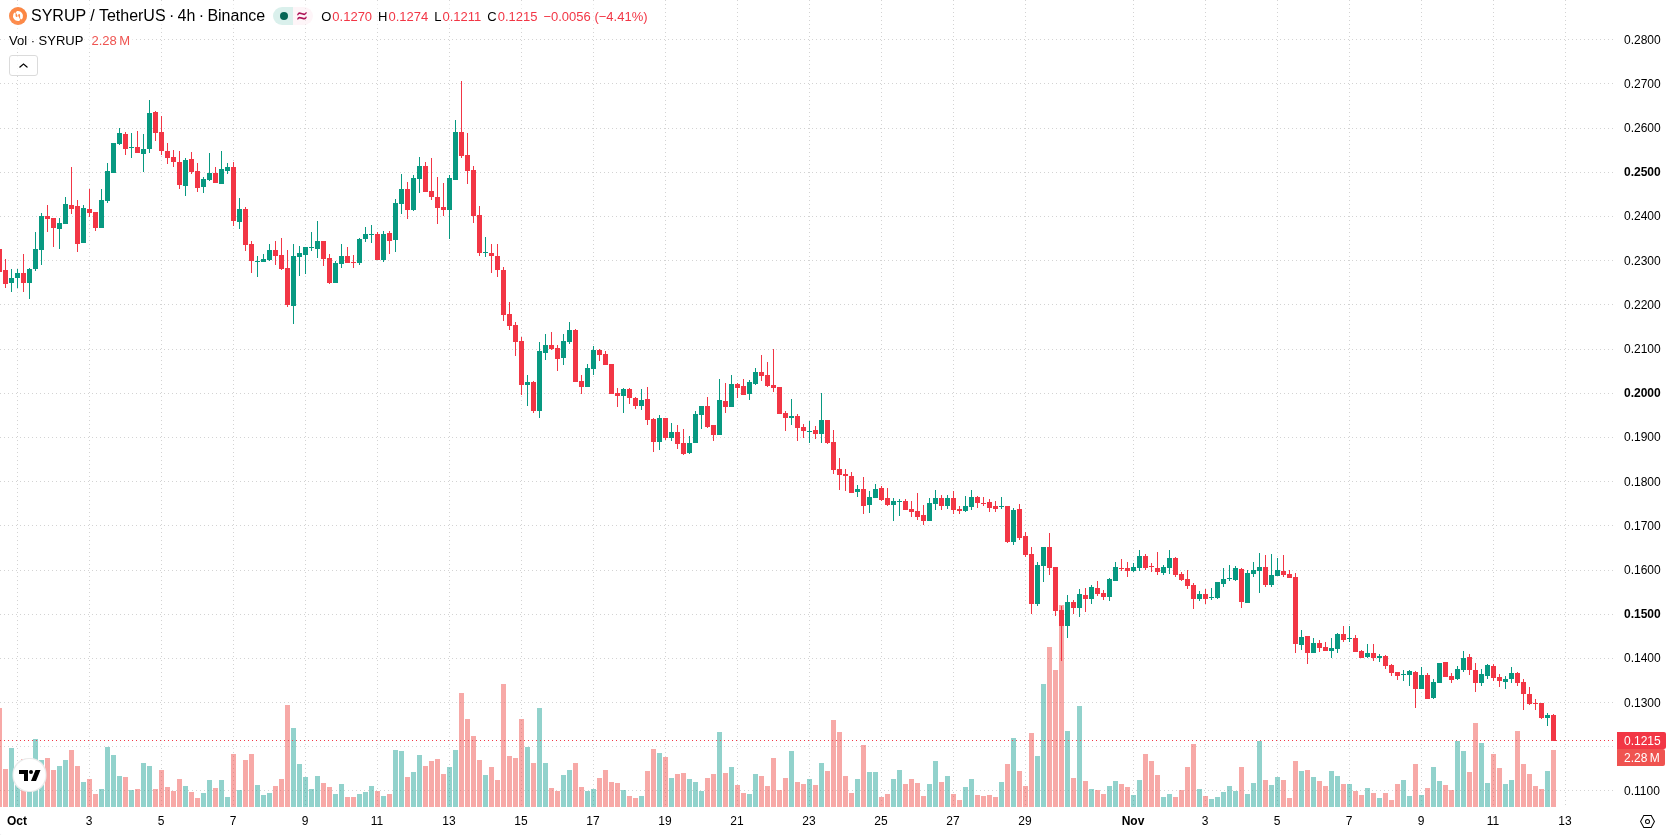
Maple (SYRUP) fell 10.26% as persistent selling pressure dominated price action, even as Q3 2026 protocol revenue was boosted by increased management fees. The drop is supported by SYRUP trading below its 20-day, 50-day, and 200-day moving averages, with sellers firmly in control across all timeframes.
 0.1142
0.1415
Highlights
- Maple increased SYRUP token buybacks to the middle tier for Q3 2026 after management fees lifted September protocol revenue to $1.57 million.
- Assets under management in syrupUSDC dropped by $320 million to $2.36 billion since October 19, and co-founder Joe Flanagan exited Maple in November 2026.
- SYRUP/USD trades below key moving averages with momentum indicators showing strong selling pressure and an expected 5-day range of $0.0965 to $0.1311.
Governance activity and AUM drop amid management transition and buybacks
Maple's SYRUP governance token buybacks reached the middle tier under the MIP-021 rule in Q3 2026, following higher management fees that raised September protocol revenue to $1.57 million. The syrupUSDC product's assets under management declined by $320 million to $2.36 billion since October 19, and the Q3 loan balance was reported 12% above the prior year. Co-founder Joe Flanagan stepped down as chairman and exited Maple in November 2026. These developments occurred even as no loans in the syrup pools or secured institutional pool have been impaired or repossessed since June 2023, though price action has remained under broader selling pressure.
Persistent downside as multi-timeframe signals align with oversold conditions
SYRUP/USD is trading below the 20-day, 50-day, and 200-day moving averages ($0.156, $0.1969, and $0.1863). This positioning signals ongoing selling pressure across short-, medium-, and long-term horizons. The immediate resistance level is $0.1246, while support sits at $0.0965. Despite a bullish medium-term alignment between the 50-day and 200-day averages, downtrend momentum is currently prevailing. Momentum indicators such as the MACD and ADX both indicate strong selling, the RSI and CCI are both in the oversold zone, and the Stochastic RSI is neutral. Intraday action favors sellers per the Bull/Bear Power indicator. The price last traded at $0.1216, down 10.26% for the day, with a downside gap at the open and session volatility at 7.06%. There is no significant divergence among technical signals, which all confirm persistent weakness.
Earlier, analysts noted that Maple (SYRUP) was facing ongoing technical weakness and persistent selling pressure, with oversold signals beginning to emerge. The current analysis reaffirms this bearish outlook with a new volatility band of $0.0965 to $0.1311 for the next five sessions, making a sustained break below $0.0965 the primary downside risk to monitor.






Latest Maple News





-
 Afghanistan
-
 Albania
-
 Algeria
-
 Angola
-
 Argentina
-
 Armenia
-
 Australia
-
 Austria
-
 Azerbaijan
-
 Bahamas
-
 Bahrain
-
 Bangladesh
-
 Belarus
-
 Belgium
-
 Bolivia
-
 Botswana
-
 Brazil
-
 Brunei
-
 Bulgaria
-
 Cambodia
-
 Cameroon
-
 Canada
-
 Chile
-
 China
-
 Colombia
-
 Congo
-
 Costa Rica
-
 Cote d'Ivoire
-
 Croatia
-
 Cuba
-
 Cyprus
-
 Czechia
-
 DR Congo
-
 Denmark
-
 Dominican Republic
-
 Ecuador
-
 Egypt
-
 El Salvador
-
 Estonia
-
 Eswatini
-
 Ethiopia
-
 Finland
-
 France
-
 Georgia
-
 Germany
-
 Ghana
-
 Greece
-
 Haiti
-
 Hong Kong
-
 Hungary
-
 India
-
 Indonesia
-
 Iran, Islamic republic
-
 Iraq
-
 Ireland
-
 Israel
-
 Italy
-
 Jamaica
-
 Japan
-
 Jordan
-
 Kazakhstan
-
 Kenya
-
 Korea
-
 Kuwait
-
 Kyrgyzstan
-
 Laos
-
 Latvia
-
 Lebanon
-
 Lesotho
-
 Libya
-
 Lithuania
-
 Luxembourg
-
 Madagascar
-
 Malaysia
-
 Malta
-
 Mauritius
-
 Mexico
-
 Moldova
-
 Mongolia
-
 Montenegro
-
 Morocco
-
 Mozambique
-
 Myanmar
-
 Namibia
-
 Nepal
-
 Netherlands
-
 New Zealand
-
 Nigeria
-
 North Macedonia
-
 Norway
-
 Oman
-
 Pakistan
-
 Palestine
-
 Panama
-
 Papua New Guinea
-
 Paraguay
-
 Peru
-
 Philippines
-
 Poland
-
 Portugal
-
 Puerto Rico
-
 Qatar
-
 Reunion
-
 Romania
-
 Rwanda
-
 Saudi Arabia
-
 Serbia
-
 Singapore
-
 Slovakia
-
 Slovenia
-
 Somalia
-
 South Africa
-
 Spain
-
 Sri Lanka
-
 Sweden
-
 Switzerland
-
 Syria
-
 Taiwan
-
 Tajikistan
-
 Tanzania
-
 Thailand
-
 Trinidad and Tobago
-
 Tunisia
-
 Turkey
-
 UAE
-
 Uganda
-
 Ukraine
-
 United Kingdom
-
United States
-
 Uruguay
-
 Uzbekistan
-
 Venezuela
-
 Vietnam
-
 Yemen
-
 Zambia
-
 Zimbabwe
- Forex
- Crypto












