


Celestia (TIA) dropped 11.63% as selling pressure intensified, accompanied by signals from short-, medium-, and long-term moving averages all trending below the current price. The move is supported by a persistent bearish technical structure, with the price trading beneath key resistance and distant from significant support levels.
 0.3854
0.4800
Highlights
- Celestia continues to provide a modular data availability layer, enabling third-party blockchain verification without relying on a single system.
- Despite ongoing adoption in its ecosystem, trading activity shows clear selling pressure and mixed asset momentum.
- TIA/USD trades below key moving averages, with prevailing bearish signals and a projected 5-day range of $0.3432 to $0.486.
Ongoing ecosystem adoption offsets but fails to reverse selling flows
Celestia has continued to operate as a modular data availability layer, providing blockchain infrastructure supporting third-party verification without reliance on a monolithic system. The asset's momentum remains mixed, with its price above some short-term averages but still below several others, reflecting ongoing adoption within its ecosystem. Broader selling pressure has remained evident in trading activity.
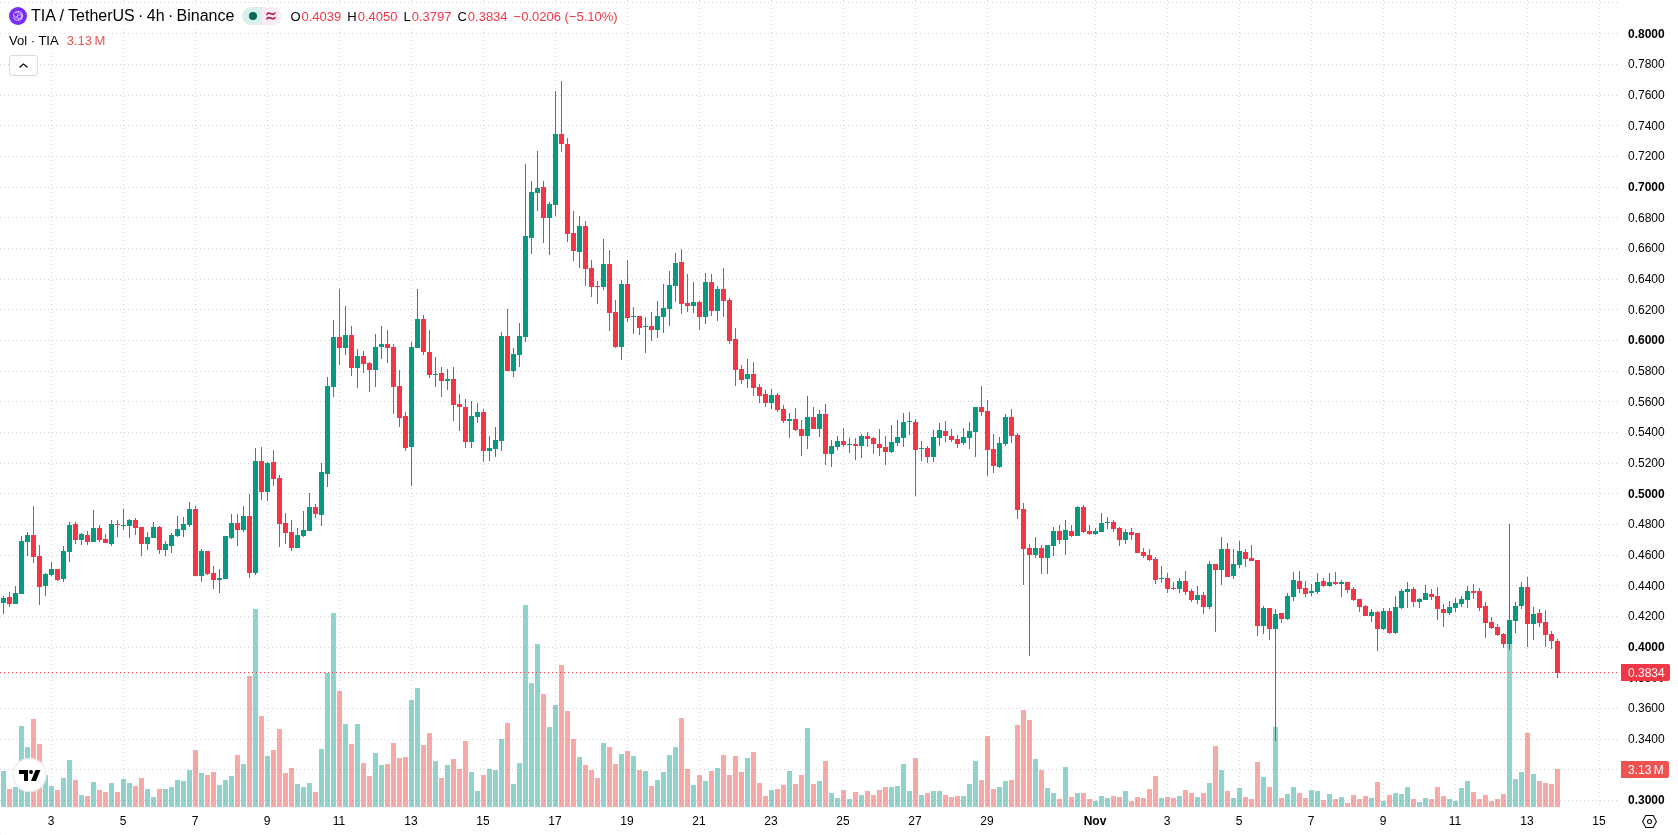
All-timeframe moving average breaches affirm sustained bearish momentum
TIA/USD is trading below its 20-day, 50-day, and 200-day moving averages (at $0.4674, $0.5049, and $0.405, respectively), reinforcing selling pressure across all observed timeframes. Key support is identified at $0.3432 and resistance at $0.3973, with technical signals like the Ichimoku Kijun confirming a bearish tone. Momentum indicators such as MACD and ADX are in the sell zone, while RSI and CCI remain neutral and Stochastic RSI is in the overbought position, highlighting a risk of near-term downside correction. Bull/Bear Power (BBP) indicates buyers have a slight intraday edge despite the overarching negative momentum.
Earlier, analysts noted that Celestia was experiencing persistent bearish momentum amid consolidation and mixed technical signals. The current analysis confirms this bearish outlook, highlighting potential downside risk and suggesting traders monitor the $0.3432 support level for signs of a trend continuation or reversal.






Latest Celestia News




-
 Afghanistan
-
 Albania
-
 Algeria
-
 Angola
-
 Argentina
-
 Armenia
-
 Australia
-
 Austria
-
 Azerbaijan
-
 Bahamas
-
 Bahrain
-
 Bangladesh
-
 Belarus
-
 Belgium
-
 Bolivia
-
 Botswana
-
 Brazil
-
 Brunei
-
 Bulgaria
-
 Cambodia
-
 Cameroon
-
 Canada
-
 Chile
-
 China
-
 Colombia
-
 Congo
-
 Costa Rica
-
 Cote d'Ivoire
-
 Croatia
-
 Cuba
-
 Cyprus
-
 Czechia
-
 DR Congo
-
 Denmark
-
 Dominican Republic
-
 Ecuador
-
 Egypt
-
 El Salvador
-
 Estonia
-
 Eswatini
-
 Ethiopia
-
 Finland
-
 France
-
 Georgia
-
 Germany
-
 Ghana
-
 Greece
-
 Haiti
-
 Hong Kong
-
 Hungary
-
 India
-
 Indonesia
-
 Iran, Islamic republic
-
 Iraq
-
 Ireland
-
 Israel
-
 Italy
-
 Jamaica
-
 Japan
-
 Jordan
-
 Kazakhstan
-
 Kenya
-
 Korea
-
 Kuwait
-
 Kyrgyzstan
-
 Laos
-
 Latvia
-
 Lebanon
-
 Lesotho
-
 Libya
-
 Lithuania
-
 Luxembourg
-
 Madagascar
-
 Malaysia
-
 Malta
-
 Mauritius
-
 Mexico
-
 Moldova
-
 Mongolia
-
 Montenegro
-
 Morocco
-
 Mozambique
-
 Myanmar
-
 Namibia
-
 Nepal
-
 Netherlands
-
 New Zealand
-
 Nigeria
-
 North Macedonia
-
 Norway
-
 Oman
-
 Pakistan
-
 Palestine
-
 Panama
-
 Papua New Guinea
-
 Paraguay
-
 Peru
-
 Philippines
-
 Poland
-
 Portugal
-
 Puerto Rico
-
 Qatar
-
 Reunion
-
 Romania
-
 Rwanda
-
 Saudi Arabia
-
 Serbia
-
 Singapore
-
 Slovakia
-
 Slovenia
-
 Somalia
-
 South Africa
-
 Spain
-
 Sri Lanka
-
 Sweden
-
 Switzerland
-
 Syria
-
 Taiwan
-
 Tajikistan
-
 Tanzania
-
 Thailand
-
 Trinidad and Tobago
-
 Tunisia
-
 Turkey
-
 UAE
-
 Uganda
-
 Ukraine
-
 United Kingdom
-
United States
-
 Uruguay
-
 Uzbekistan
-
 Venezuela
-
 Vietnam
-
 Yemen
-
 Zambia
-
 Zimbabwe
- Forex
- Crypto












