

Celestia technical analysis: Downward price move as sellers keep control

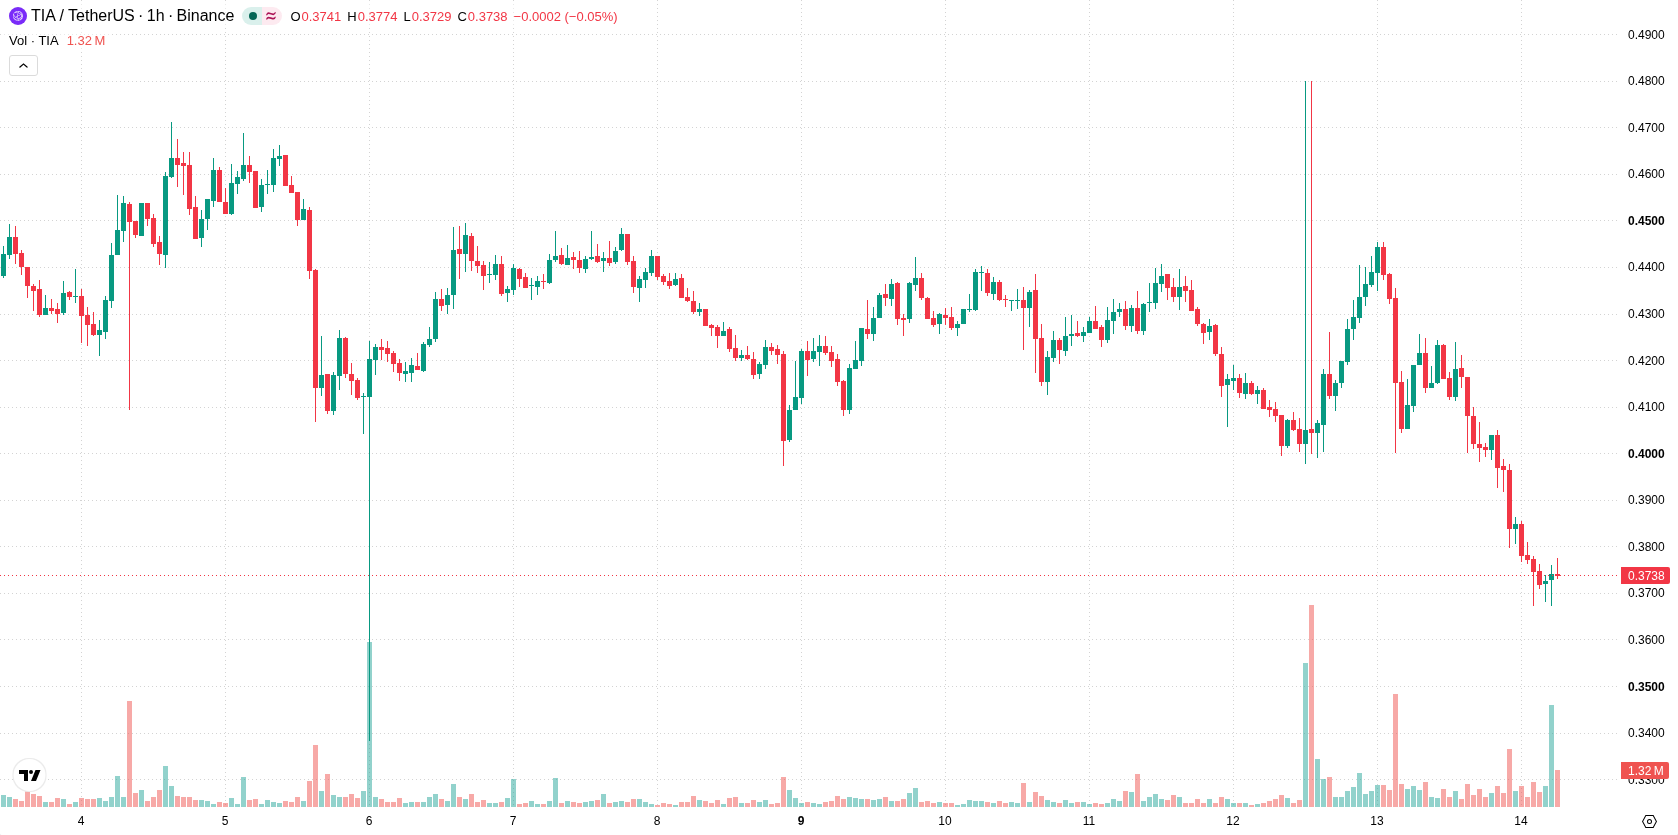
Celestia (TIA) is trading at $0.3748 after an 8.59% drop on the day, positioning itself below its key moving averages. Today's decline reflects the asset's persistent weakness, with the price sitting near the day's low and continuing to move away from immediate support zones.
 0.3854
0.4800
Highlights
- Celestia's Voyager blockchain architecture reached over 21 million transfers per second, showing a major advance in scalability.
- Recent trading activity has been led by selling, despite the technical improvement in Celestia's infrastructure.
- TIA/USD trades below major moving averages and technical indicators project a 78% probability of further downside to $0.3354 to $0.3972 in the next few sessions.
Long-term scalability strengthens as selling dominates near-term trading
Celestia's Voyager Blockchain architecture has achieved a benchmark of over 21 million account-to-account transfers per second (TPS), according to Blockchain. This milestone highlights a significant improvement in the technical scalability and potential efficiency of Celestia's infrastructure, suggesting competitive strength in Blockchain throughput. While such advances can boost long-term confidence in the project, recent trading has remained dominated by selling activity.
Technical barriers and oversold signals reinforce bearish momentum
On the technical front, TIA/USD trades below the MA-20 at $0.3955 and MA-50 at $0.4086 on the hourly chart, with the daily price also sitting under the MA-200 at $0.4053. The Ichimoku Kijun level at $0.3963 stands as immediate resistance. Momentum indicators reinforce the prevailing weakness: both the MACD and ADX confirm bearish momentum, while RSI, Stoch RSI, and CCI are each in oversold territory, indicating selling exhaustion without yet signaling a reversal. Bull/Bear Power remains negative, and the Awesome Oscillator continues to align with the downtrend.
Downside risk prevails as upside reversal needs key breakout
Short-term price action is likely to remain pressured, with TIA/USD expected to consolidate within a projected volatility band of $0.3354 to $0.3972 over the next two to three sessions. Upside probability is currently limited at 22%, while further declines are more likely with a 78% probability. A move above $0.3963 would be required to trigger a bullish reversal scenario, whereas a decisive break below support at $0.3354 would signal additional downside risk.
Earlier, analysts noted that Celestia was experiencing persistent bearish momentum amid ongoing consolidation and mixed technical signals. The latest developments reinforce this negative outlook, with traders advised to monitor the $0.3354 support level for any signs of additional downside risk or a potential reversal.






Latest Celestia News




-
 Afghanistan
-
 Albania
-
 Algeria
-
 Angola
-
 Argentina
-
 Armenia
-
 Australia
-
 Austria
-
 Azerbaijan
-
 Bahamas
-
 Bahrain
-
 Bangladesh
-
 Belarus
-
 Belgium
-
 Bolivia
-
 Botswana
-
 Brazil
-
 Brunei
-
 Bulgaria
-
 Cambodia
-
 Cameroon
-
 Canada
-
 Chile
-
 China
-
 Colombia
-
 Congo
-
 Costa Rica
-
 Cote d'Ivoire
-
 Croatia
-
 Cuba
-
 Cyprus
-
 Czechia
-
 DR Congo
-
 Denmark
-
 Dominican Republic
-
 Ecuador
-
 Egypt
-
 El Salvador
-
 Estonia
-
 Eswatini
-
 Ethiopia
-
 Finland
-
 France
-
 Georgia
-
 Germany
-
 Ghana
-
 Greece
-
 Haiti
-
 Hong Kong
-
 Hungary
-
 India
-
 Indonesia
-
 Iran, Islamic republic
-
 Iraq
-
 Ireland
-
 Israel
-
 Italy
-
 Jamaica
-
 Japan
-
 Jordan
-
 Kazakhstan
-
 Kenya
-
 Korea
-
 Kuwait
-
 Kyrgyzstan
-
 Laos
-
 Latvia
-
 Lebanon
-
 Lesotho
-
 Libya
-
 Lithuania
-
 Luxembourg
-
 Madagascar
-
 Malaysia
-
 Malta
-
 Mauritius
-
 Mexico
-
 Moldova
-
 Mongolia
-
 Montenegro
-
 Morocco
-
 Mozambique
-
 Myanmar
-
 Namibia
-
 Nepal
-
 Netherlands
-
 New Zealand
-
 Nigeria
-
 North Macedonia
-
 Norway
-
 Oman
-
 Pakistan
-
 Palestine
-
 Panama
-
 Papua New Guinea
-
 Paraguay
-
 Peru
-
 Philippines
-
 Poland
-
 Portugal
-
 Puerto Rico
-
 Qatar
-
 Reunion
-
 Romania
-
 Rwanda
-
 Saudi Arabia
-
 Serbia
-
 Singapore
-
 Slovakia
-
 Slovenia
-
 Somalia
-
 South Africa
-
 Spain
-
 Sri Lanka
-
 Sweden
-
 Switzerland
-
 Syria
-
 Taiwan
-
 Tajikistan
-
 Tanzania
-
 Thailand
-
 Trinidad and Tobago
-
 Tunisia
-
 Turkey
-
 UAE
-
 Uganda
-
 Ukraine
-
 United Kingdom
-
United States
-
 Uruguay
-
 Uzbekistan
-
 Venezuela
-
 Vietnam
-
 Yemen
-
 Zambia
-
 Zimbabwe
- Forex
- Crypto












