

Aave technical analysis: Seller pressure dominates as price holds near $99.49 support

Aave (AAVE) is trading at $105.16, down 8.2% for the session and sitting near today’s low. The asset remains below its key moving averages, indicating ongoing downward pressure.
 111.04
132.51
Highlights
- Aave V4 reached record deposits of $1.75 billion as of November 13, 2026, driven by significant inflows from EtherFi Cash and Circle Arc.
- Large ETH sales by BTCS to cover $64.1 million in Aave-related debt contributed to recent shifts in liquidity and flows.
- AAVE/USD trades below key moving averages and momentum signals are decisively bearish, with an expected 2 to 3 day range of $99.49 to $110.83.
Liquidity and operational shifts as deposits surge but debt sales weigh
Aave V4 deposits reached a record $1.75 billion as of November 13, 2026, driven by inflows from EtherFi Cash, Circle's Arc, and a new hub-and-spoke design, according to Cryptobriefing. While the surge in deposits expanded protocol liquidity and signaled active engagement, large-scale ETH sales by BTCS to cover $64.1 million in Aave-related debt, as reported by Cryptonews, may have contributed to recent shifts in asset-specific liquidity and market flows. Additional developments include a governance proposal from TokenLogic to raise the protocol’s reserve factor and the launch of a loan exchange feature on Aave Pro’s V4 markets, both aimed at refining operational mechanics. These factors together mark a period of substantial protocol activity, though price action has remained under broader selling pressure.
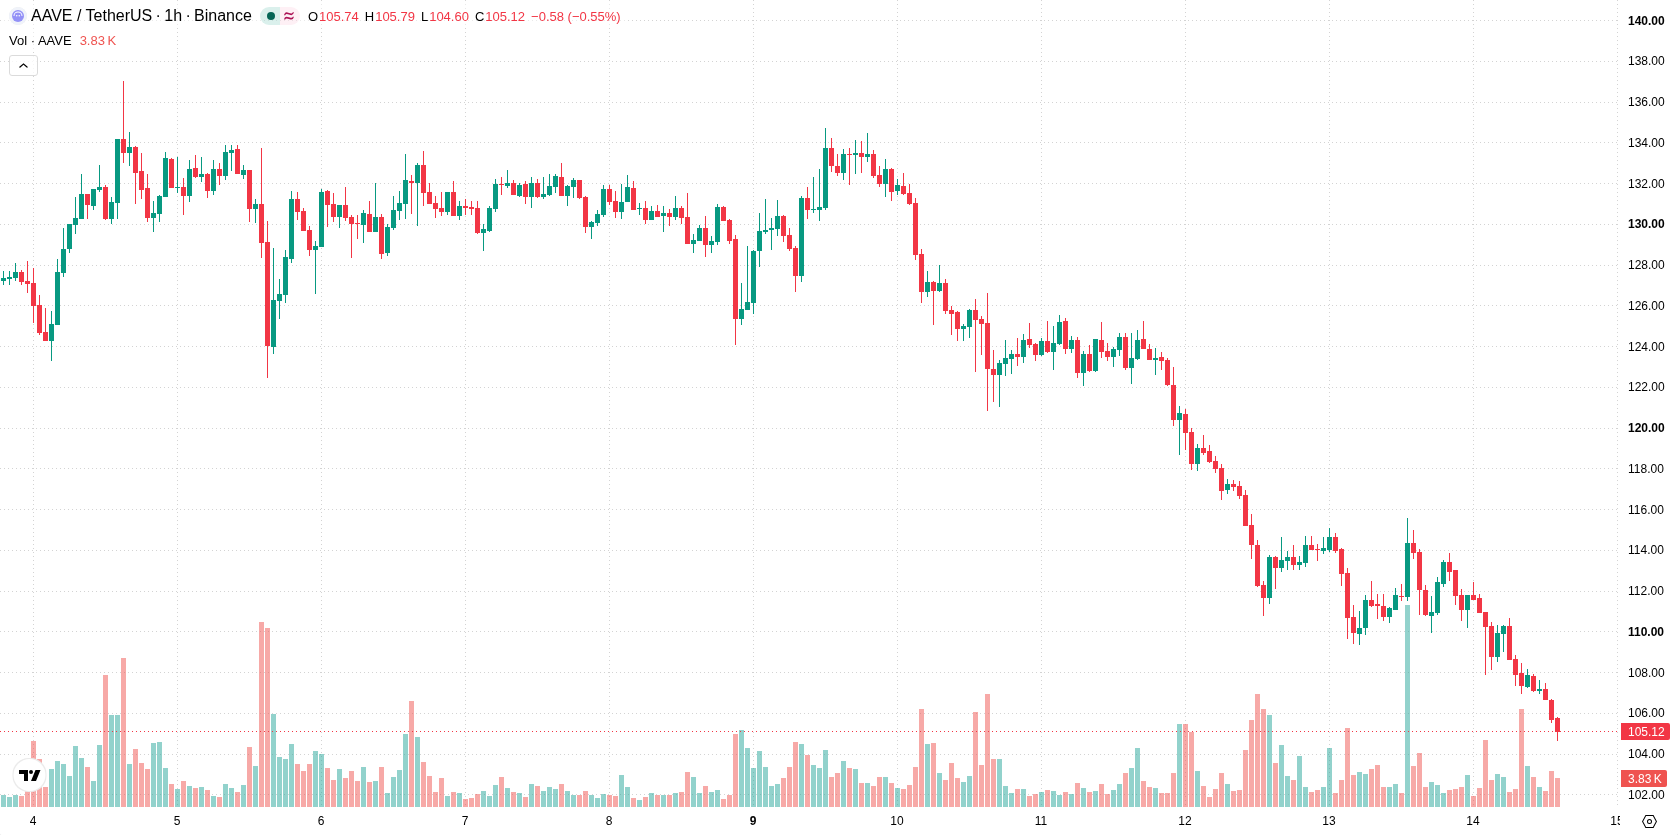
Downside momentum builds as major supports tested and signals oversold
AAVE/USD remains below its MA-20, MA-50, and MA-200, reflecting pressure across short-, medium-, and long-term technical trends. The Ichimoku Kijun at $110.7 stands as immediate resistance, with support established at $99.49. Both MACD and ADX confirm ongoing selling pressure, while RSI, Stochastic RSI, and CCI are positioned deeply in their oversold zones, indicating potential for a technical rebound though no reversal is currently confirmed. Bull/Bear Power remains negative at -1.53, favoring sellers, and the Awesome Oscillator reinforces a continuing downward trend.
Elevated downside risk as recovery tied to resistance breakout
In the short term, AAVE is expected to trade between $99.49 and $110.83, consistent with prevailing volatility. The likelihood of an upward move is low, while downside risk is elevated, making sustained recovery less probable without a breakout above $110.7. A bullish scenario requires clear price action above this resistance, while a sustained breakdown below $99.49 would confirm further weakness.
Earlier, analysts noted that Aave was under persistent downside pressure, with technical indicators suggesting ongoing vulnerability as the asset traded below key resistance. This view is reinforced by the latest session’s new price lows and continued weakness across all major moving averages, highlighting $110.7 as a critical level for any potential recovery.










-
 Afghanistan
-
 Albania
-
 Algeria
-
 Angola
-
 Argentina
-
 Armenia
-
 Australia
-
 Austria
-
 Azerbaijan
-
 Bahamas
-
 Bahrain
-
 Bangladesh
-
 Belarus
-
 Belgium
-
 Bolivia
-
 Botswana
-
 Brazil
-
 Brunei
-
 Bulgaria
-
 Cambodia
-
 Cameroon
-
 Canada
-
 Chile
-
 China
-
 Colombia
-
 Congo
-
 Costa Rica
-
 Cote d'Ivoire
-
 Croatia
-
 Cuba
-
 Cyprus
-
 Czechia
-
 DR Congo
-
 Denmark
-
 Dominican Republic
-
 Ecuador
-
 Egypt
-
 El Salvador
-
 Estonia
-
 Eswatini
-
 Ethiopia
-
 Finland
-
 France
-
 Georgia
-
 Germany
-
 Ghana
-
 Greece
-
 Haiti
-
 Hong Kong
-
 Hungary
-
 India
-
 Indonesia
-
 Iran, Islamic republic
-
 Iraq
-
 Ireland
-
 Israel
-
 Italy
-
 Jamaica
-
 Japan
-
 Jordan
-
 Kazakhstan
-
 Kenya
-
 Korea
-
 Kuwait
-
 Kyrgyzstan
-
 Laos
-
 Latvia
-
 Lebanon
-
 Lesotho
-
 Libya
-
 Lithuania
-
 Luxembourg
-
 Madagascar
-
 Malaysia
-
 Malta
-
 Mauritius
-
 Mexico
-
 Moldova
-
 Mongolia
-
 Montenegro
-
 Morocco
-
 Mozambique
-
 Myanmar
-
 Namibia
-
 Nepal
-
 Netherlands
-
 New Zealand
-
 Nigeria
-
 North Macedonia
-
 Norway
-
 Oman
-
 Pakistan
-
 Palestine
-
 Panama
-
 Papua New Guinea
-
 Paraguay
-
 Peru
-
 Philippines
-
 Poland
-
 Portugal
-
 Puerto Rico
-
 Qatar
-
 Reunion
-
 Romania
-
 Rwanda
-
 Saudi Arabia
-
 Serbia
-
 Singapore
-
 Slovakia
-
 Slovenia
-
 Somalia
-
 South Africa
-
 Spain
-
 Sri Lanka
-
 Sweden
-
 Switzerland
-
 Syria
-
 Taiwan
-
 Tajikistan
-
 Tanzania
-
 Thailand
-
 Trinidad and Tobago
-
 Tunisia
-
 Turkey
-
 UAE
-
 Uganda
-
 Ukraine
-
 United Kingdom
-
United States
-
 Uruguay
-
 Uzbekistan
-
 Venezuela
-
 Vietnam
-
 Yemen
-
 Zambia
-
 Zimbabwe
- Forex
- Crypto












