


Pendle (PENDLE) dropped 10.3% amid persistent technical selling pressure, as momentum and major indicators signal a strong downward bias. The quality of the move is supported by the asset trading below all its key moving averages, with sellers dominating across short, medium, and long-term timeframes.
 1.541
1.6410
Highlights
- PENDLE/USD continues to trade below key short, medium, and long term moving averages, confirming persistent downward pressure across timeframes.
- Momentum, MACD, and ADX indicate a pronounced sell bias, with additional confirmation from negative Bull/Bear Power and a sharp 10.3% intraday loss.
- Expected five-day price range is $1.213 to $1.4645, with an 80% probability of further decline barring a reversal above $1.4645.
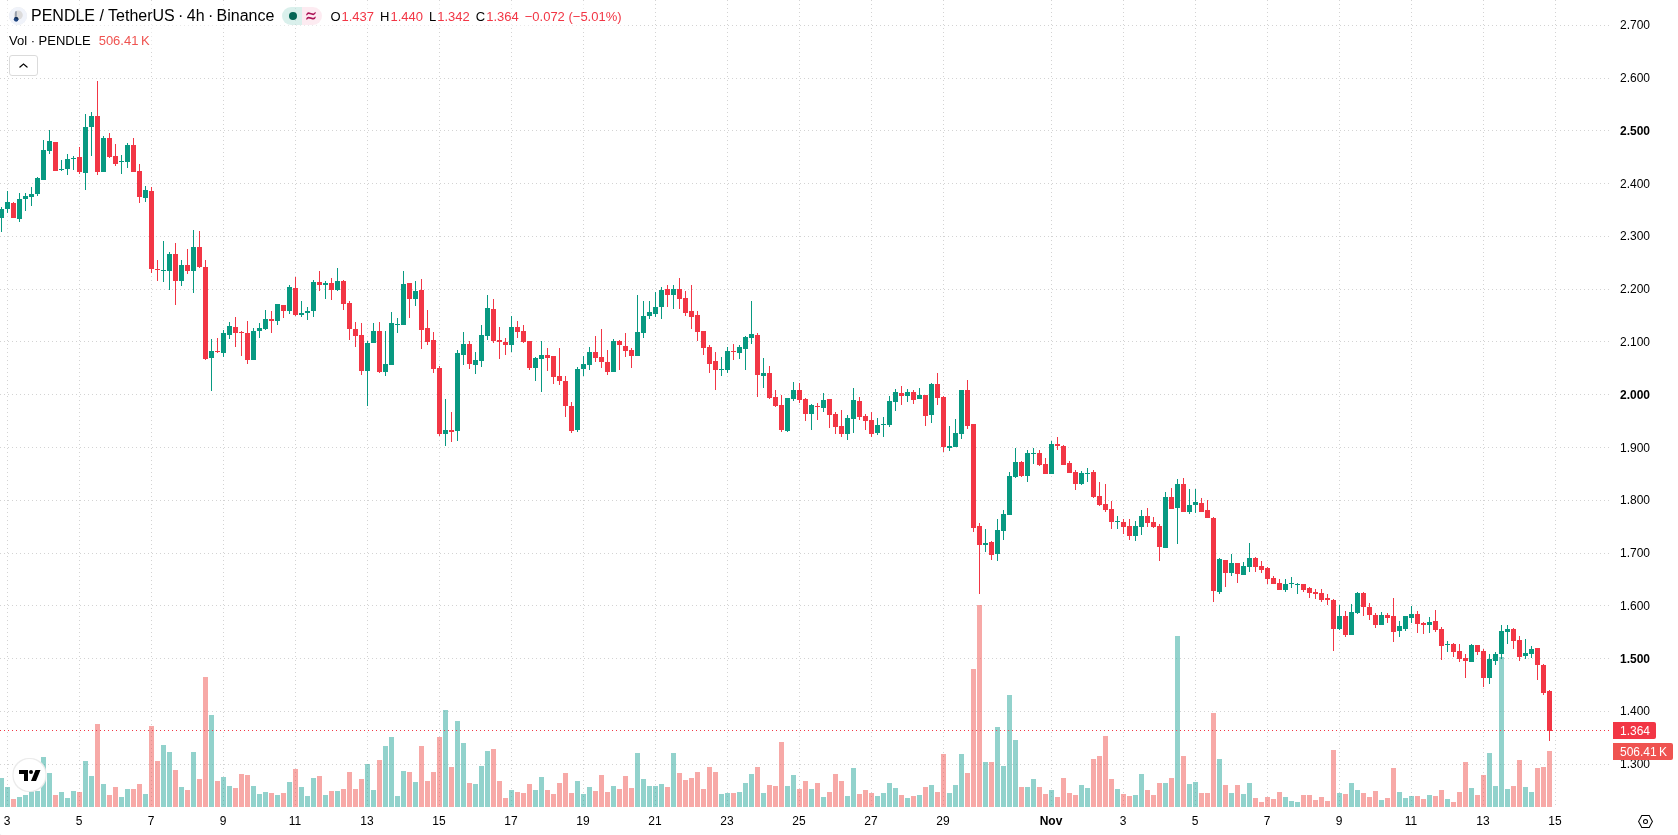
Momentum stays bearish as oversold signals appear
PENDLE/USD is trading below its 20-day, 50-day, and 200-day moving averages (MA-20: $1.7382, MA-50: $2.038, MA-200: $1.7413), confirming persistent selling pressure across all major timeframes. The nearest resistance is seen at $1.446, with immediate support at $1.342 and broader levels aligning with a bearish outlook. Technical indicators also favor bears: the MACD and ADX both signal a clear sell, while the Bull/Bear Power (BBP) remains negative, showing sellers in control of intraday momentum. RSI and CCI both sit in oversold zones, suggesting a risk of rebound, but Stochastic RSI and the Awesome Oscillator are neutral. Pendle lost $0.157, or 10.3%, with volatility at 14.83%, and price closing near session lows. While most signals confirm intense downward momentum, some indicators reflect early signs of seller exhaustion.
Earlier, analysts noted that Pendle faced persistent technical weakness, with sellers dominating across all key timeframes and indicators pointing to a bearish outlook. The latest data reinforce this view, and traders should closely monitor the $1.213 support level, as a decisive break below this threshold would signal renewed downside risk.










-
 Afghanistan
-
 Albania
-
 Algeria
-
 Angola
-
 Argentina
-
 Armenia
-
 Australia
-
 Austria
-
 Azerbaijan
-
 Bahamas
-
 Bahrain
-
 Bangladesh
-
 Belarus
-
 Belgium
-
 Bolivia
-
 Botswana
-
 Brazil
-
 Brunei
-
 Bulgaria
-
 Cambodia
-
 Cameroon
-
 Canada
-
 Chile
-
 China
-
 Colombia
-
 Congo
-
 Costa Rica
-
 Cote d'Ivoire
-
 Croatia
-
 Cuba
-
 Cyprus
-
 Czechia
-
 DR Congo
-
 Denmark
-
 Dominican Republic
-
 Ecuador
-
 Egypt
-
 El Salvador
-
 Estonia
-
 Eswatini
-
 Ethiopia
-
 Finland
-
 France
-
 Georgia
-
 Germany
-
 Ghana
-
 Greece
-
 Haiti
-
 Hong Kong
-
 Hungary
-
 India
-
 Indonesia
-
 Iran, Islamic republic
-
 Iraq
-
 Ireland
-
 Israel
-
 Italy
-
 Jamaica
-
 Japan
-
 Jordan
-
 Kazakhstan
-
 Kenya
-
 Korea
-
 Kuwait
-
 Kyrgyzstan
-
 Laos
-
 Latvia
-
 Lebanon
-
 Lesotho
-
 Libya
-
 Lithuania
-
 Luxembourg
-
 Madagascar
-
 Malaysia
-
 Malta
-
 Mauritius
-
 Mexico
-
 Moldova
-
 Mongolia
-
 Montenegro
-
 Morocco
-
 Mozambique
-
 Myanmar
-
 Namibia
-
 Nepal
-
 Netherlands
-
 New Zealand
-
 Nigeria
-
 North Macedonia
-
 Norway
-
 Oman
-
 Pakistan
-
 Palestine
-
 Panama
-
 Papua New Guinea
-
 Paraguay
-
 Peru
-
 Philippines
-
 Poland
-
 Portugal
-
 Puerto Rico
-
 Qatar
-
 Reunion
-
 Romania
-
 Rwanda
-
 Saudi Arabia
-
 Serbia
-
 Singapore
-
 Slovakia
-
 Slovenia
-
 Somalia
-
 South Africa
-
 Spain
-
 Sri Lanka
-
 Sweden
-
 Switzerland
-
 Syria
-
 Taiwan
-
 Tajikistan
-
 Tanzania
-
 Thailand
-
 Trinidad and Tobago
-
 Tunisia
-
 Turkey
-
 UAE
-
 Uganda
-
 Ukraine
-
 United Kingdom
-
United States
-
 Uruguay
-
 Uzbekistan
-
 Venezuela
-
 Vietnam
-
 Yemen
-
 Zambia
-
 Zimbabwe
- Forex
- Crypto












