

Will Pendle avoid deeper losses amid persistent bearish momentum?

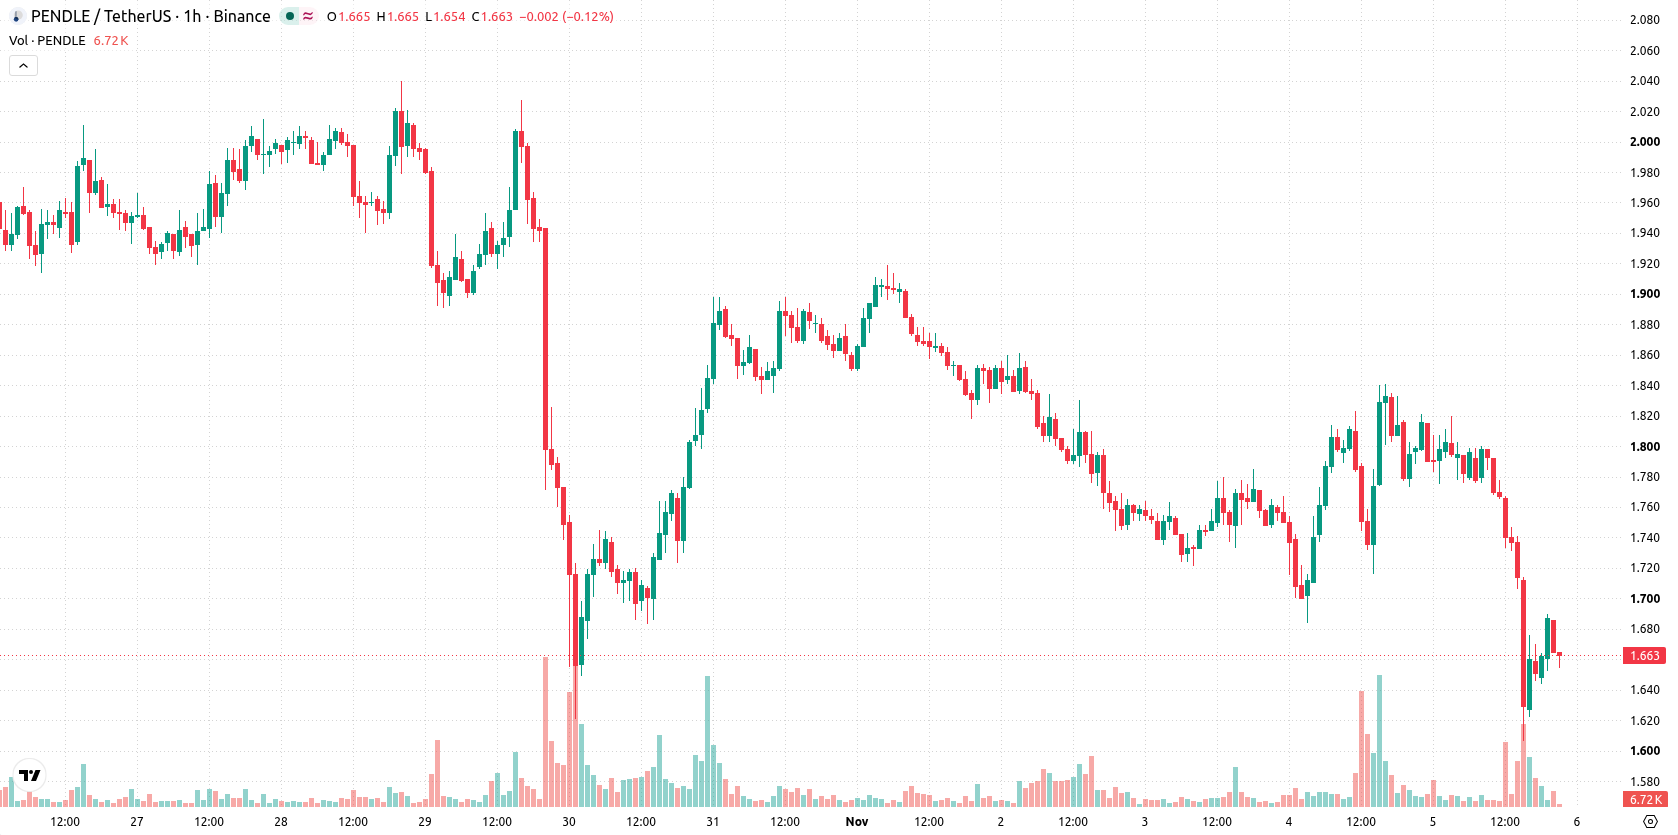
Pendle (PENDLE) is trading at $1.66, down 7.62% on the day. The move leaves the asset below its short- and medium-term moving averages, with price currently near session lows amid heightened volatility.
 1.6
1.8410
Highlights
- Pendle introduced PendleLoop, offering automated leveraged trading with up to 29% APY on wstETH loops and zero fees until end of 2026.
- The platform expanded support for tokenized US stocks and real-world assets and reached a 30-day trading volume high of $221.5 million on November 4.
- PENDLE trades below key moving averages with strong bearish momentum, projecting a likely price range of $1.501 to $1.7266 in the coming days.
Protocol upgrades and asset inflows offset by persistent selling pressure
Pendle launched PendleLoop, an automated leveraged trading solution supporting both crypto and tokenized US stock positions, with up to 29% APY on wstETH loops and zero protocol fees until the end of 2026. This rollout introduces new structured products and incentivizes protocol engagement, potentially driving higher capital flows into Pendle's ecosystem. Pendle also enabled looping strategies for non-principal tokens and introduced a dedicated Real-World Asset interface, enhancing transparency and yield options for Ethereum and stablecoin holders. On November 4, Pendle's daily trading volume touched a 30-day high of $221.5 million, according to Cryptonews, accompanied by an expanding share of real-world assets as reported by Tokenpost, though price action has remained under broader selling pressure.
Bearish bias and resistance persist amid mixed momentum signals
PENDLE is trading below the MA-20 and MA-50 on the one-hour timeframe as well as under the MA-200 on the daily chart. The Ichimoku Kijun sits at $1.7135 and currently acts as immediate resistance for any recovery attempts. MACD and ADX both indicate bearish momentum, while price action is dominated by sellers as shown by negative Bull/Bear Power. RSI, Stoch RSI, and CCI remain neutral, and the Awesome Oscillator does not confirm a clear directional bias.
Further downside likely as recovery probability deteriorates
Over the next 2 to 3 trading days, the expected price range for PENDLE is $1.501 to $1.7266. The probability of a sustained upward move is very low, while further downside is highly likely, making a near-term recovery less probable. The baseline scenario is for price consolidation within this volatility band; a break above the $1.7135 resistance could trigger a moderate retracement, whereas a drop below $1.501 would likely signal renewed selling pressure and open the way for further declines.
Earlier, analysts noted that Pendle faced sustained selling pressure despite new product integrations aimed at expanding real-world asset access. The current analysis strengthens this view by highlighting deepening bearish momentum and volatility, with traders advised to monitor the $1.501 level as a critical threshold for potential renewed downside.










-
 Afghanistan
-
 Albania
-
 Algeria
-
 Angola
-
 Argentina
-
 Armenia
-
 Australia
-
 Austria
-
 Azerbaijan
-
 Bahamas
-
 Bahrain
-
 Bangladesh
-
 Belarus
-
 Belgium
-
 Bolivia
-
 Botswana
-
 Brazil
-
 Brunei
-
 Bulgaria
-
 Cambodia
-
 Cameroon
-
 Canada
-
 Chile
-
 China
-
 Colombia
-
 Congo
-
 Costa Rica
-
 Cote d'Ivoire
-
 Croatia
-
 Cuba
-
 Cyprus
-
 Czechia
-
 DR Congo
-
 Denmark
-
 Dominican Republic
-
 Ecuador
-
 Egypt
-
 El Salvador
-
 Estonia
-
 Eswatini
-
 Ethiopia
-
 Finland
-
 France
-
 Georgia
-
 Germany
-
 Ghana
-
 Greece
-
 Haiti
-
 Hong Kong
-
 Hungary
-
 India
-
 Indonesia
-
 Iran, Islamic republic
-
 Iraq
-
 Ireland
-
 Israel
-
 Italy
-
 Jamaica
-
 Japan
-
 Jordan
-
 Kazakhstan
-
 Kenya
-
 Korea
-
 Kuwait
-
 Kyrgyzstan
-
 Laos
-
 Latvia
-
 Lebanon
-
 Lesotho
-
 Libya
-
 Lithuania
-
 Luxembourg
-
 Madagascar
-
 Malaysia
-
 Malta
-
 Mauritius
-
 Mexico
-
 Moldova
-
 Mongolia
-
 Montenegro
-
 Morocco
-
 Mozambique
-
 Myanmar
-
 Namibia
-
 Nepal
-
 Netherlands
-
 New Zealand
-
 Nigeria
-
 North Macedonia
-
 Norway
-
 Oman
-
 Pakistan
-
 Palestine
-
 Panama
-
 Papua New Guinea
-
 Paraguay
-
 Peru
-
 Philippines
-
 Poland
-
 Portugal
-
 Puerto Rico
-
 Qatar
-
 Reunion
-
 Romania
-
 Rwanda
-
 Saudi Arabia
-
 Serbia
-
 Singapore
-
 Slovakia
-
 Slovenia
-
 Somalia
-
 South Africa
-
 Spain
-
 Sri Lanka
-
 Sweden
-
 Switzerland
-
 Syria
-
 Taiwan
-
 Tajikistan
-
 Tanzania
-
 Thailand
-
 Trinidad and Tobago
-
 Tunisia
-
 Turkey
-
 UAE
-
 Uganda
-
 Ukraine
-
 United Kingdom
-
United States
-
 Uruguay
-
 Uzbekistan
-
 Venezuela
-
 Vietnam
-
 Yemen
-
 Zambia
-
 Zimbabwe
- Forex
- Crypto












