

Pendle drops more than 11% after technicals signal strong downside momentum

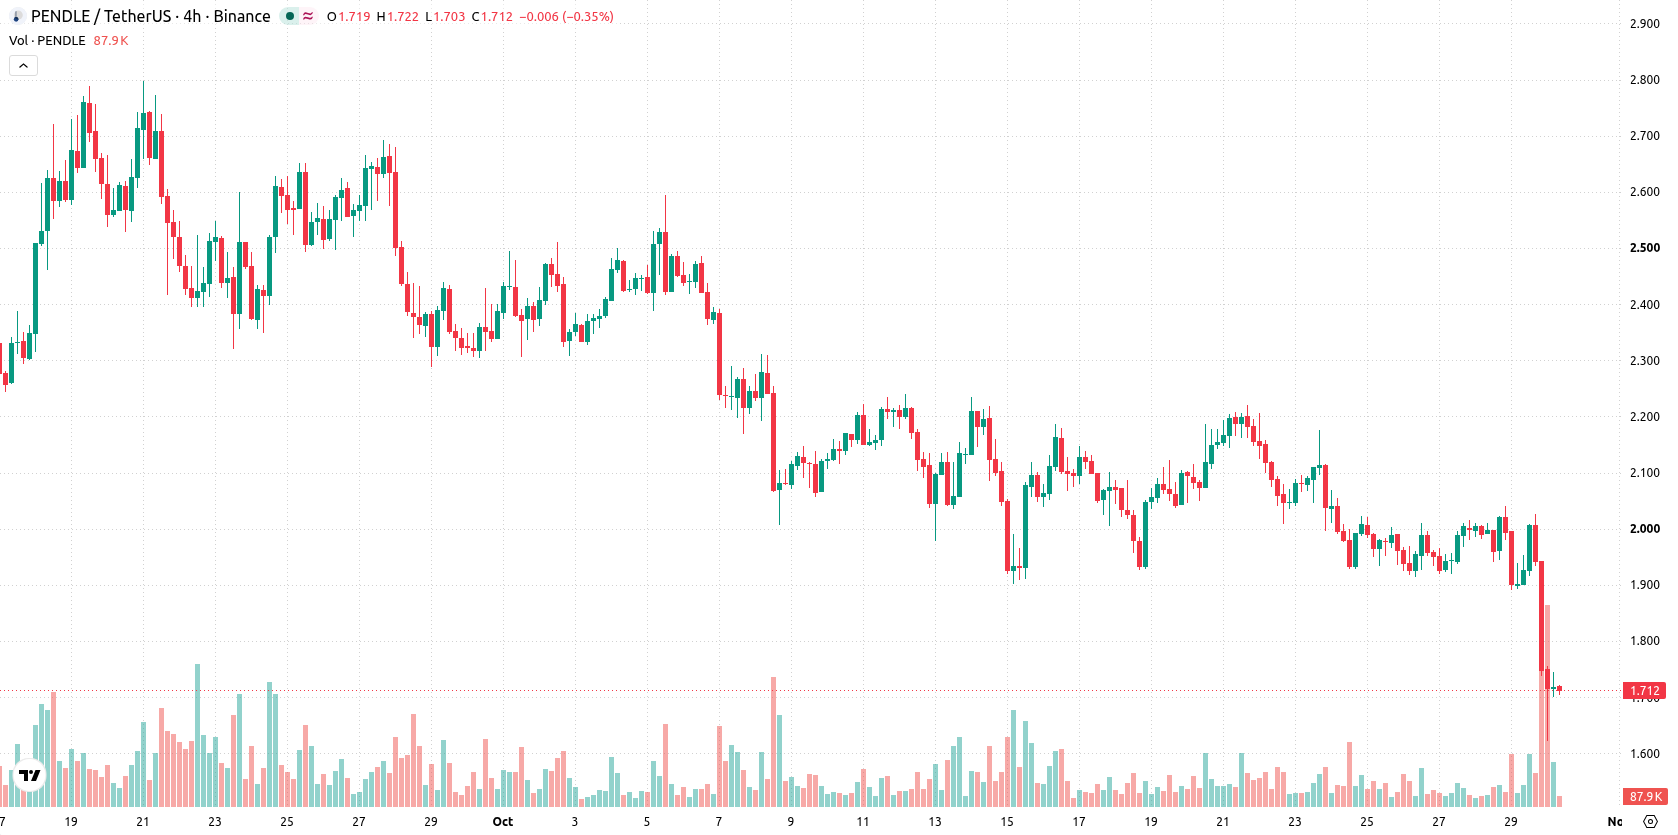
Pendle (PENDLE) slumped 11.3% as sustained seller pressure took hold, even as the protocol's third-quarter update showed a sharp rise in total value locked, earnings efficiency, and continued buybacks. The move is reinforced by Pendle trading below its key 20-day, 50-day, and 200-day moving averages, with technical readings pointing to strong downside momentum and limited signs of near-term recovery.
 1.861
2.0400
Highlights
- Pendle reported a 43% increase in Total Value Locked to $1.16 billion in Q3 2026, with real-world assets making up 82% of TVL.
- Earnings per dollar of TVL rose 76% year over year as incentive emissions were cut by over 50% and token buybacks exceeded triple the emission rate.
- PENDLE/USD trades below key moving averages with technical indicators showing oversold conditions and a very high probability of a move to the $1.5455 to $1.8765 range in the next five days.
Rising real-world asset share and buybacks fail to offset selling pressure
Pendle, a DeFi protocol, reported a 43% increase in Total Value Locked to $1.16 billion during the third quarter of 2026, with real-world asset markets now comprising 82% of its TVL. The protocol reduced incentive emissions by more than 50%, yet earnings per dollar of TVL climbed by approximately 76% compared to the previous year. Pendle carried out token buybacks at over triple its emission rate, directing 80% of retained fees to repurchases, and listed an on-chain version of the Partners Group Next Generation Infrastructure fund via Asseto Finance's NGI+. Its STRCx tokenized equity asset also surpassed $50 million in value, with Pendle controlling about 30% of its total supply, though price action has remained under broader selling pressure.
Sustained downtrend confirmed by multi-timeframe averages and oversold momentum
PENDLE/USD is currently trading below its 20-day, 50-day, and 200-day moving averages ($2.0632, $2.2512, and $1.7122, respectively), which points to sustained seller pressure across short, medium, and long-term timeframes. The 200-day moving average at $1.7122 and the Ichimoku Kijun at $2.2425 both confirm the prevailing downtrend, with immediate resistance at $1.7122 and support at the session low of $1.621; the long-term alignment remains bullish. Momentum readings remain negative, with the Moving Average Convergence Divergence (MACD) and Average Directional Index (ADX) both in "Sell" territory, indicating weak upside potential. The Relative Strength Index (RSI) stands at 37.41 and the Commodity Channel Index (CCI) at -122.71, both registering "Oversold" signals, while the Stochastic RSI is extremely low at 2.68, further highlighting oversold conditions. Bull/Bear Power (BBP) reads -0.002, showing that sellers dominate intraday momentum. The session began with a downside gap of around 9.3%. The overall tone is heavy, with strong downward momentum and limited signs of intraday recovery.
Earlier, analysts noted that despite constructive protocol developments, Pendle’s price action was dominated by persistent technical weakness and downside risk. The latest trading data reinforces this view, with sellers maintaining control and the primary scenario now centered on whether price can decisively hold above the $1.5455 support level in the days ahead.











-
 Afghanistan
-
 Albania
-
 Algeria
-
 Angola
-
 Argentina
-
 Armenia
-
 Australia
-
 Austria
-
 Azerbaijan
-
 Bahamas
-
 Bahrain
-
 Bangladesh
-
 Belarus
-
 Belgium
-
 Bolivia
-
 Botswana
-
 Brazil
-
 Brunei
-
 Bulgaria
-
 Cambodia
-
 Cameroon
-
 Canada
-
 Chile
-
 China
-
 Colombia
-
 Congo
-
 Costa Rica
-
 Cote d'Ivoire
-
 Croatia
-
 Cuba
-
 Cyprus
-
 Czechia
-
 DR Congo
-
 Denmark
-
 Dominican Republic
-
 Ecuador
-
 Egypt
-
 El Salvador
-
 Estonia
-
 Eswatini
-
 Ethiopia
-
 Finland
-
 France
-
 Georgia
-
 Germany
-
 Ghana
-
 Greece
-
 Haiti
-
 Hong Kong
-
 Hungary
-
 India
-
 Indonesia
-
 Iran, Islamic republic
-
 Iraq
-
 Ireland
-
 Israel
-
 Italy
-
 Jamaica
-
 Japan
-
 Jordan
-
 Kazakhstan
-
 Kenya
-
 Korea
-
 Kuwait
-
 Kyrgyzstan
-
 Laos
-
 Latvia
-
 Lebanon
-
 Lesotho
-
 Libya
-
 Lithuania
-
 Luxembourg
-
 Madagascar
-
 Malaysia
-
 Malta
-
 Mauritius
-
 Mexico
-
 Moldova
-
 Mongolia
-
 Montenegro
-
 Morocco
-
 Mozambique
-
 Myanmar
-
 Namibia
-
 Nepal
-
 Netherlands
-
 New Zealand
-
 Nigeria
-
 North Macedonia
-
 Norway
-
 Oman
-
 Pakistan
-
 Palestine
-
 Panama
-
 Papua New Guinea
-
 Paraguay
-
 Peru
-
 Philippines
-
 Poland
-
 Portugal
-
 Puerto Rico
-
 Qatar
-
 Reunion
-
 Romania
-
 Rwanda
-
 Saudi Arabia
-
 Serbia
-
 Singapore
-
 Slovakia
-
 Slovenia
-
 Somalia
-
 South Africa
-
 Spain
-
 Sri Lanka
-
 Sweden
-
 Switzerland
-
 Syria
-
 Taiwan
-
 Tajikistan
-
 Tanzania
-
 Thailand
-
 Trinidad and Tobago
-
 Tunisia
-
 Turkey
-
 UAE
-
 Uganda
-
 Ukraine
-
 United Kingdom
-
United States
-
 Uruguay
-
 Uzbekistan
-
 Venezuela
-
 Vietnam
-
 Yemen
-
 Zambia
-
 Zimbabwe
- Forex
- Crypto












