

Fetch.ai price prediction: Downside risk elevated as consolidation persists near $0.1224 support

Fetch.ai (FET) is trading at $0.1299, down 7.68% on the day. The price sits below its key moving averages, reflecting ongoing selling momentum in the short, medium, and longer-term timeframes.
 0.1351
0.1544
Highlights
- FET/USD trades below key moving averages across all timeframes, confirming dominant downside momentum from sellers.
- Technical indicators show strong sell signals from MACD and ADX, with volatility high and signals mixed intraday.
- Expected price range over the next 2 to 3 days is $0.1224 to $0.1374, with a 70% probability of further decline.
Momentum signals deteriorate as FET faces layered resistance
On the hourly chart, FET is trading below its MA-20 and MA-50, while the daily chart shows a pronounced break underneath the MA-200. The Ichimoku Kijun at $0.1322 is acting as immediate resistance. MACD indicates a strong sell signal, and ADX reinforces ongoing seller momentum. RSI and CCI are both in the neutral range, while Stochastic RSI sits in the overbought zone, suggesting the potential for short-term price swings or overheating. Bull/Bear Power is slightly positive, giving a marginal nod to intraday buyers, but this contradicts the overall negative momentum backdrop. Awesome Oscillator is neutral, and price remains volatile, trading near today's high after a sharp drop and an initial gap down.
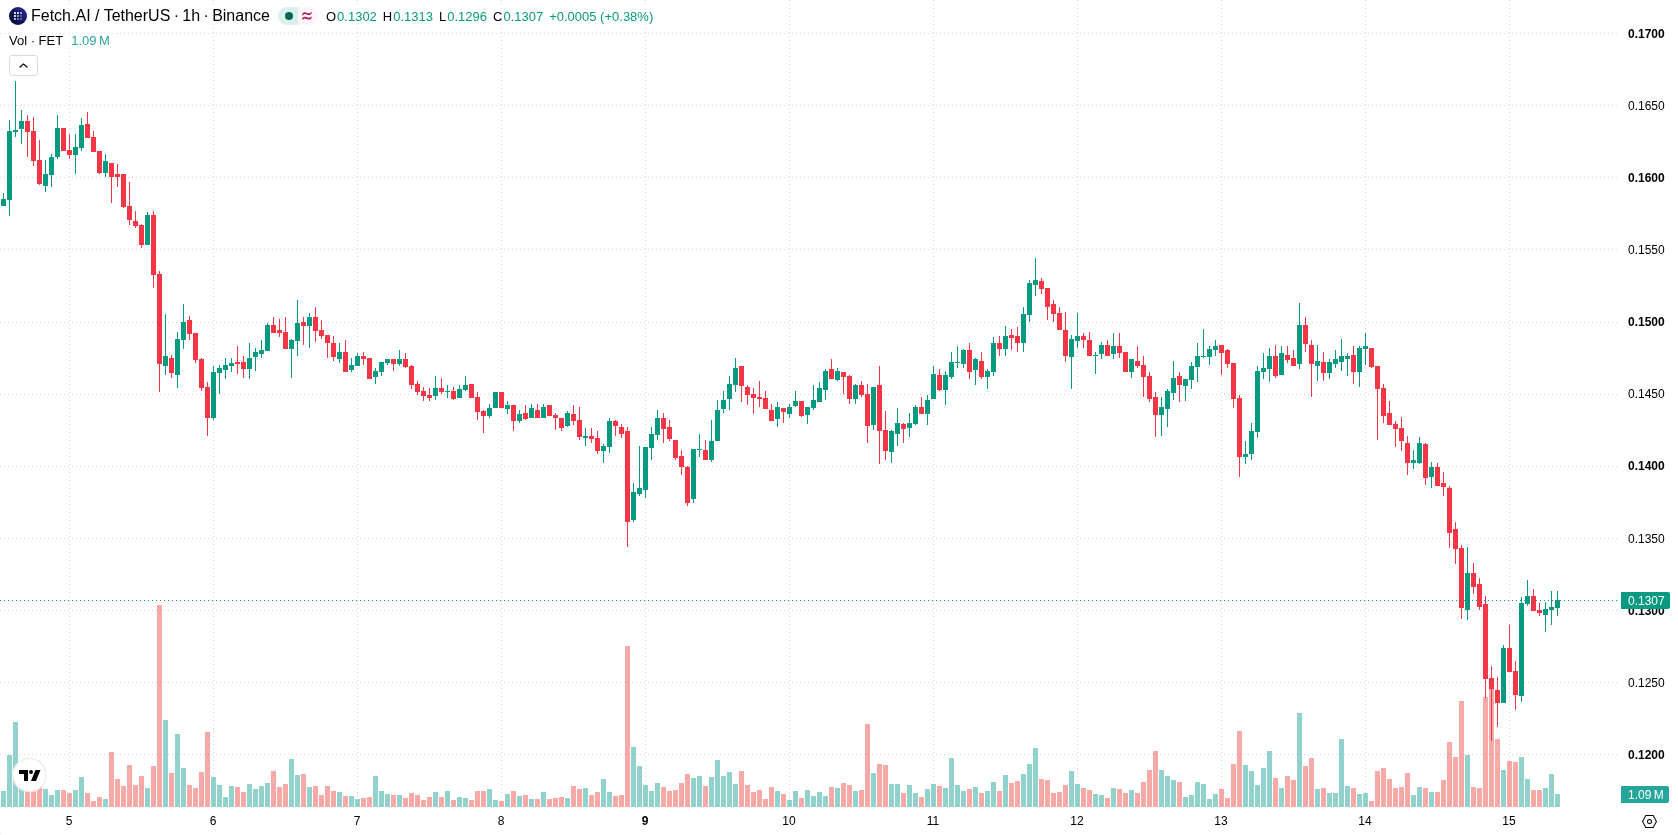
Downside risk prevails as price approaches key support range
For the upcoming 2-3 trading days, FET is expected to trade within a range of $0.1224 to $0.1374. Downside risk remains elevated, with a 70% chance of further price declines and only a 30% probability of a rebound. The base case scenario is for the price to consolidate within this range. A bullish scenario would require a break above immediate resistance, potentially drawing in buyers, while a move below support could trigger additional selling pressure and accelerate losses.
Earlier, analysts noted that Fetch.ai was facing persistent bearish pressure, with broad-based technical indicators pointing to elevated downside risk. The latest price action reinforces this outlook, highlighting continued selling momentum and making the current support zone a crucial level for traders to monitor in the near term.










-
 Afghanistan
-
 Albania
-
 Algeria
-
 Angola
-
 Argentina
-
 Armenia
-
 Australia
-
 Austria
-
 Azerbaijan
-
 Bahamas
-
 Bahrain
-
 Bangladesh
-
 Belarus
-
 Belgium
-
 Bolivia
-
 Botswana
-
 Brazil
-
 Brunei
-
 Bulgaria
-
 Cambodia
-
 Cameroon
-
 Canada
-
 Chile
-
 China
-
 Colombia
-
 Congo
-
 Costa Rica
-
 Cote d'Ivoire
-
 Croatia
-
 Cuba
-
 Cyprus
-
 Czechia
-
 DR Congo
-
 Denmark
-
 Dominican Republic
-
 Ecuador
-
 Egypt
-
 El Salvador
-
 Estonia
-
 Eswatini
-
 Ethiopia
-
 Finland
-
 France
-
 Georgia
-
 Germany
-
 Ghana
-
 Greece
-
 Haiti
-
 Hong Kong
-
 Hungary
-
 India
-
 Indonesia
-
 Iran, Islamic republic
-
 Iraq
-
 Ireland
-
 Israel
-
 Italy
-
 Jamaica
-
 Japan
-
 Jordan
-
 Kazakhstan
-
 Kenya
-
 Korea
-
 Kuwait
-
 Kyrgyzstan
-
 Laos
-
 Latvia
-
 Lebanon
-
 Lesotho
-
 Libya
-
 Lithuania
-
 Luxembourg
-
 Madagascar
-
 Malaysia
-
 Malta
-
 Mauritius
-
 Mexico
-
 Moldova
-
 Mongolia
-
 Montenegro
-
 Morocco
-
 Mozambique
-
 Myanmar
-
 Namibia
-
 Nepal
-
 Netherlands
-
 New Zealand
-
 Nigeria
-
 North Macedonia
-
 Norway
-
 Oman
-
 Pakistan
-
 Palestine
-
 Panama
-
 Papua New Guinea
-
 Paraguay
-
 Peru
-
 Philippines
-
 Poland
-
 Portugal
-
 Puerto Rico
-
 Qatar
-
 Reunion
-
 Romania
-
 Rwanda
-
 Saudi Arabia
-
 Serbia
-
 Singapore
-
 Slovakia
-
 Slovenia
-
 Somalia
-
 South Africa
-
 Spain
-
 Sri Lanka
-
 Sweden
-
 Switzerland
-
 Syria
-
 Taiwan
-
 Tajikistan
-
 Tanzania
-
 Thailand
-
 Trinidad and Tobago
-
 Tunisia
-
 Turkey
-
 UAE
-
 Uganda
-
 Ukraine
-
 United Kingdom
-
United States
-
 Uruguay
-
 Uzbekistan
-
 Venezuela
-
 Vietnam
-
 Yemen
-
 Zambia
-
 Zimbabwe
- Forex
- Crypto












