

Solana moves lower as ETF outflows reduce institutional demand and weigh on token price

Solana (SOL) is trading lower, with the recent move shaped by prolonged ETF outflows from US spot Solana funds. Institutional selling via ETF redemptions is contributing to a fragile market backdrop. Investors are monitoring ETF flows for any sign of stabilization or reversal.
 73.28
88.46
Highlights
- US spot Solana ETFs posted $58.3 million in net outflows over seven sessions ending November 13, 2026, led by redemptions from Fidelity.
- Sustained ETF outflows decreased institutional demand and increased selling pressure, reducing price stability in the absence of offsetting inflows.
- SOL trades below key moving averages with momentum indicators bearish, and $76.63 represents critical resistance for recovery attempts if ETF flow trends reverse.
US spot Solana ETF outflows and resulting demand risk
According to Cryptoticker, US spot Solana ETFs faced net outflows over seven consecutive trading sessions through November 13, 2026, totaling approximately $58.3 million, with $3.1 million withdrawn on the final day, mainly from Fidelity's fund.
These outflows directly reduced institutional demand for SOL and increased selling pressure, presenting a key risk to price stability via diminished ETF demand.
No offsetting fund inflows or countervailing institutional demand were reported to limit the impact of these ETF redemptions over the period.
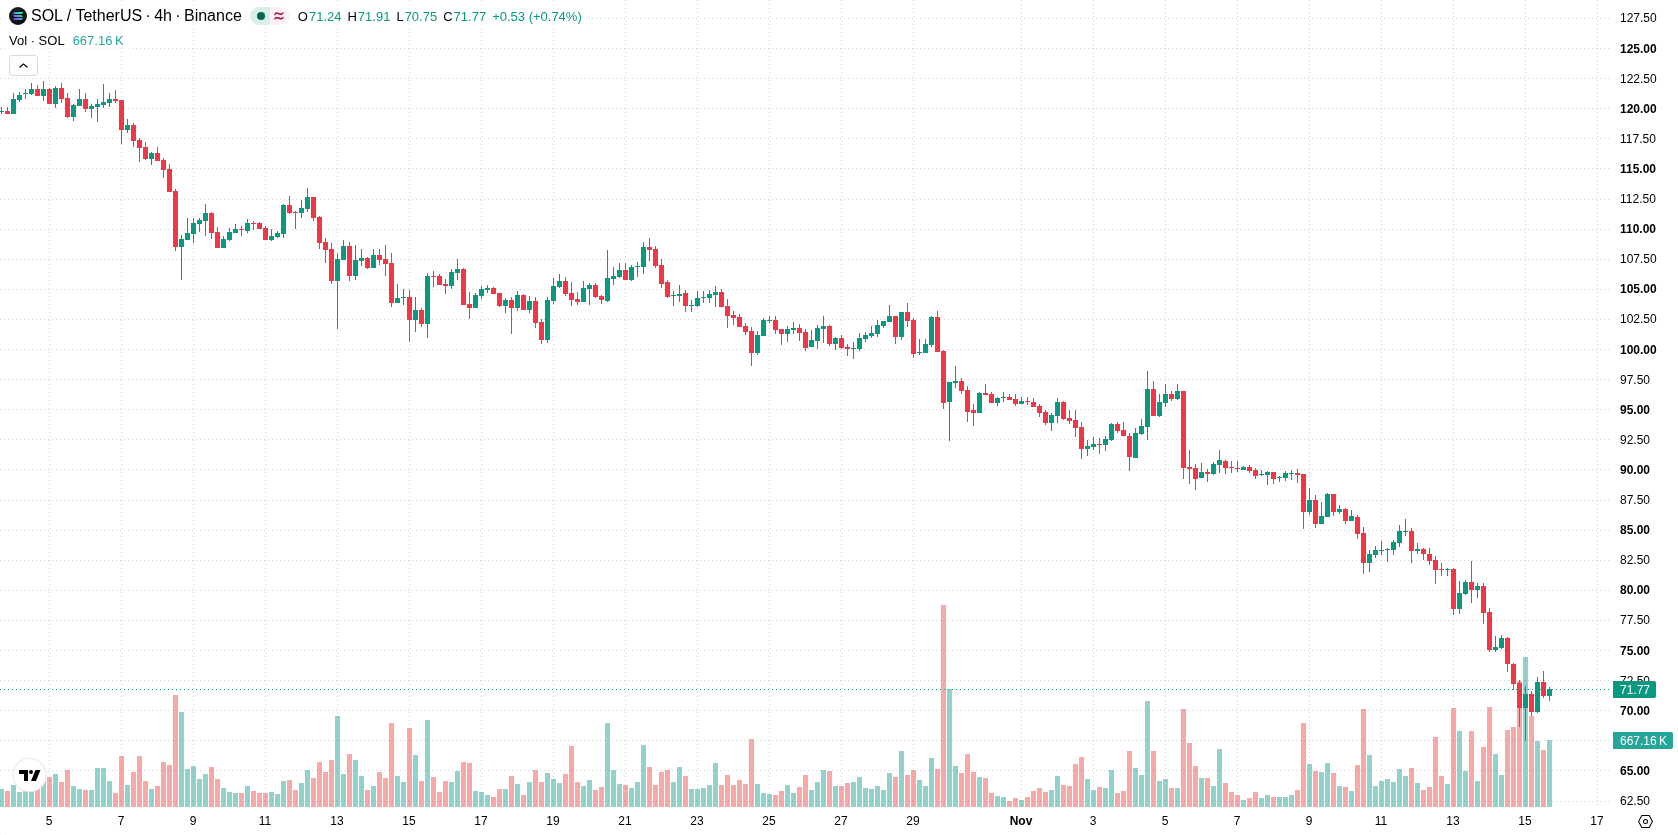
Sustained ETF selling pressure weakens the 4H technical setup
With outflows driving the macro backdrop, the 4H chart shows SOL below its 50- and 200-period simple moving averages, highlighting a technically weak structure. The MACD and ADX both align with a sell bias, reinforcing the current downside environment.
The H4 Ichimoku Kijun level at $76.63 is identified as a resistance area. Any near-term efforts to recover would likely be capped unless ETF flows stabilize and SOL can reclaim this threshold.
Institutional flow stabilization needed to reclaim resistance
Further ETF outflows could maintain downward pressure, while a stabilization or reversal in fund flows may set the stage for recovery attempts. The $76.63 Kijun level is crucial resistance; a sustained move above it would signal improving conditions. Until then, SOL remains vulnerable to additional volatility tied to institutional trading and ETF sentiment.
Earlier, analysts noted that persistent ETF outflows and institutional selling had created a downside bias for Solana amid broader liquidity concerns. The current analysis reinforces this outlook, highlighting that ongoing ETF redemptions remain the primary macro factor dictating price direction, with stabilization in fund flows necessary for any sustained recovery.











-
 Afghanistan
-
 Albania
-
 Algeria
-
 Angola
-
 Argentina
-
 Armenia
-
 Australia
-
 Austria
-
 Azerbaijan
-
 Bahamas
-
 Bahrain
-
 Bangladesh
-
 Belarus
-
 Belgium
-
 Bolivia
-
 Botswana
-
 Brazil
-
 Brunei
-
 Bulgaria
-
 Cambodia
-
 Cameroon
-
 Canada
-
 Chile
-
 China
-
 Colombia
-
 Congo
-
 Costa Rica
-
 Cote d'Ivoire
-
 Croatia
-
 Cuba
-
 Cyprus
-
 Czechia
-
 DR Congo
-
 Denmark
-
 Dominican Republic
-
 Ecuador
-
 Egypt
-
 El Salvador
-
 Estonia
-
 Eswatini
-
 Ethiopia
-
 Finland
-
 France
-
 Georgia
-
 Germany
-
 Ghana
-
 Greece
-
 Haiti
-
 Hong Kong
-
 Hungary
-
 India
-
 Indonesia
-
 Iran, Islamic republic
-
 Iraq
-
 Ireland
-
 Israel
-
 Italy
-
 Jamaica
-
 Japan
-
 Jordan
-
 Kazakhstan
-
 Kenya
-
 Korea
-
 Kuwait
-
 Kyrgyzstan
-
 Laos
-
 Latvia
-
 Lebanon
-
 Lesotho
-
 Libya
-
 Lithuania
-
 Luxembourg
-
 Madagascar
-
 Malaysia
-
 Malta
-
 Mauritius
-
 Mexico
-
 Moldova
-
 Mongolia
-
 Montenegro
-
 Morocco
-
 Mozambique
-
 Myanmar
-
 Namibia
-
 Nepal
-
 Netherlands
-
 New Zealand
-
 Nigeria
-
 North Macedonia
-
 Norway
-
 Oman
-
 Pakistan
-
 Palestine
-
 Panama
-
 Papua New Guinea
-
 Paraguay
-
 Peru
-
 Philippines
-
 Poland
-
 Portugal
-
 Puerto Rico
-
 Qatar
-
 Reunion
-
 Romania
-
 Rwanda
-
 Saudi Arabia
-
 Serbia
-
 Singapore
-
 Slovakia
-
 Slovenia
-
 Somalia
-
 South Africa
-
 Spain
-
 Sri Lanka
-
 Sweden
-
 Switzerland
-
 Syria
-
 Taiwan
-
 Tajikistan
-
 Tanzania
-
 Thailand
-
 Trinidad and Tobago
-
 Tunisia
-
 Turkey
-
 UAE
-
 Uganda
-
 Ukraine
-
 United Kingdom
-
United States
-
 Uruguay
-
 Uzbekistan
-
 Venezuela
-
 Vietnam
-
 Yemen
-
 Zambia
-
 Zimbabwe
- Forex
- Crypto












