

Can ETF withdrawals pressure Bitcoin despite neutral technical signals?

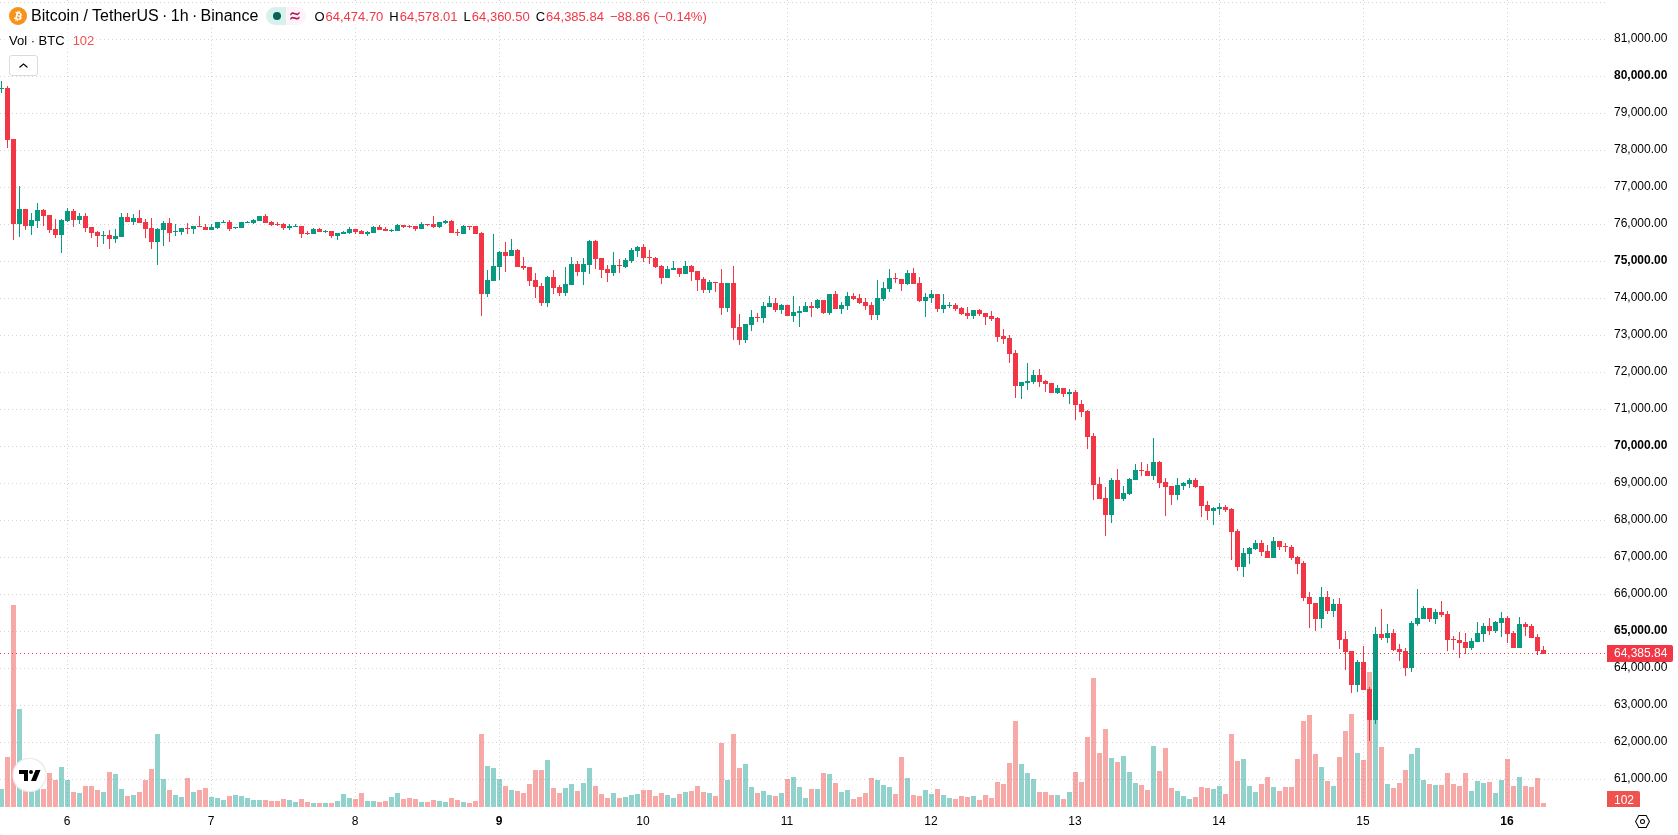
Bitcoin (BTC) is trading at $64,440, registering a slight intraday uptick. The price remains below its key moving averages, continuing to signal a cautious and subdued trading tone.
 65392.01
75442.01
Highlights
- US spot Bitcoin ETFs saw $1.91 billion in net outflows over seven trading sessions through November 13.
- Large institutional withdrawals and increased liquidation activity have reduced overall market liquidity for Bitcoin.
- BTC/USD currently trades below key moving averages, with weak momentum and is expected to range between $61,436 to $67,444 over the next 2 to 3 days.
Institutional outflows and liquidations weaken bitcoin demand
US spot Bitcoin ETFs experienced roughly $1.91 billion in net outflows over seven consecutive trading sessions through November 13, with substantial liquidations amplifying pressure on the market, according to Crypto. This wave of institutional capital leaving spot Bitcoin exposure reduces available market liquidity, increasing vulnerability to downside moves. Alongside these outflows, liquidation activity has contributed to a less supportive environment for Bitcoin demand.
Mixed momentum signals as price tests intraday resistance
On the hourly chart, BTC remains below the MA-20 ($65,055), MA-50 ($65,391), and the more distant MA-200 ($72,977). The Ichimoku Kijun level at $64,954 acts as immediate resistance. Momentum readings are mixed: MACD is set up for a strong sell, ADX is neutral, and both RSI and Stochastic RSI remain balanced with no overbought or oversold signals. CCI is also neutral, Bull/Bear Power sits at 203.12, suggesting some intraday buyer activity, while the Awesome Oscillator remains neutral. Price is near the low end of today’s range, with continued moderate volatility and a visible gap from the prior close.
Low breakout odds with downside bias in near-term range
Looking ahead to the next 2–3 trading days, BTC is expected to move within a range of $61,436 to $67,444. The probability of an upside breakout is very low, with downside continuation more likely, making a sustained rebound less probable. The baseline scenario favors sideways consolidation inside this volatility band; a bullish scenario requires a confirmed break above $64,954 (Kijun resistance), while a fall below $61,436 would expose the market to deeper declines.
Earlier, analysts noted that the outlook for Bitcoin was heavily influenced by persistent ETF outflows and macroeconomic policy signals, emphasizing continued market pressure. This current analysis reinforces that view, highlighting ongoing institutional outflows and the need to monitor the $64,954 Kijun resistance level as a key trigger for any potential shift away from the prevailing sideways-to-downside bias.










-
 Afghanistan
-
 Albania
-
 Algeria
-
 Angola
-
 Argentina
-
 Armenia
-
 Australia
-
 Austria
-
 Azerbaijan
-
 Bahamas
-
 Bahrain
-
 Bangladesh
-
 Belarus
-
 Belgium
-
 Bolivia
-
 Botswana
-
 Brazil
-
 Brunei
-
 Bulgaria
-
 Cambodia
-
 Cameroon
-
 Canada
-
 Chile
-
 China
-
 Colombia
-
 Congo
-
 Costa Rica
-
 Cote d'Ivoire
-
 Croatia
-
 Cuba
-
 Cyprus
-
 Czechia
-
 DR Congo
-
 Denmark
-
 Dominican Republic
-
 Ecuador
-
 Egypt
-
 El Salvador
-
 Estonia
-
 Eswatini
-
 Ethiopia
-
 Finland
-
 France
-
 Georgia
-
 Germany
-
 Ghana
-
 Greece
-
 Haiti
-
 Hong Kong
-
 Hungary
-
 India
-
 Indonesia
-
 Iran, Islamic republic
-
 Iraq
-
 Ireland
-
 Israel
-
 Italy
-
 Jamaica
-
 Japan
-
 Jordan
-
 Kazakhstan
-
 Kenya
-
 Korea
-
 Kuwait
-
 Kyrgyzstan
-
 Laos
-
 Latvia
-
 Lebanon
-
 Lesotho
-
 Libya
-
 Lithuania
-
 Luxembourg
-
 Madagascar
-
 Malaysia
-
 Malta
-
 Mauritius
-
 Mexico
-
 Moldova
-
 Mongolia
-
 Montenegro
-
 Morocco
-
 Mozambique
-
 Myanmar
-
 Namibia
-
 Nepal
-
 Netherlands
-
 New Zealand
-
 Nigeria
-
 North Macedonia
-
 Norway
-
 Oman
-
 Pakistan
-
 Palestine
-
 Panama
-
 Papua New Guinea
-
 Paraguay
-
 Peru
-
 Philippines
-
 Poland
-
 Portugal
-
 Puerto Rico
-
 Qatar
-
 Reunion
-
 Romania
-
 Rwanda
-
 Saudi Arabia
-
 Serbia
-
 Singapore
-
 Slovakia
-
 Slovenia
-
 Somalia
-
 South Africa
-
 Spain
-
 Sri Lanka
-
 Sweden
-
 Switzerland
-
 Syria
-
 Taiwan
-
 Tajikistan
-
 Tanzania
-
 Thailand
-
 Trinidad and Tobago
-
 Tunisia
-
 Turkey
-
 UAE
-
 Uganda
-
 Ukraine
-
 United Kingdom
-
United States
-
 Uruguay
-
 Uzbekistan
-
 Venezuela
-
 Vietnam
-
 Yemen
-
 Zambia
-
 Zimbabwe
- Forex
- Crypto












